Poster
advertisement

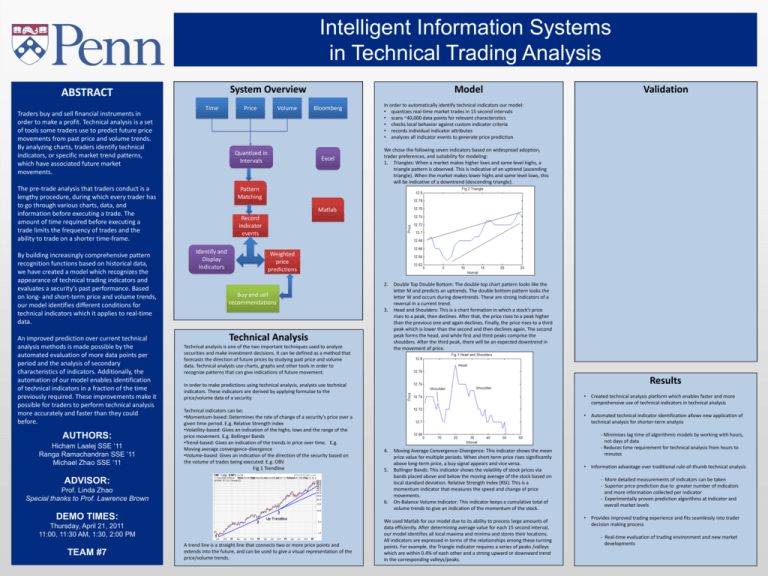
Intelligent Information Systems in Technical Trading Analysis System Overview ABSTRACT Traders buy and sell financial instruments in order to make a profit. Technical analysis is a set of tools some traders use to predict future price movements from past price and volume trends. By analyzing charts, traders identify technical indicators, or specific market trend patterns, which have associated future market movements. Time An improved prediction over current technical analysis methods is made possible by the automated evaluation of more data points per period and the analysis of secondary characteristics of indicators. Additionally, the automation of our model enables identification of technical indicators in a fraction of the time previously required. These improvements make it possible for traders to perform technical analysis more accurately and faster than they could before. AUTHORS: Hicham Laalej SSE ‘11 Ranga Ramachandran SSE ‘11 Michael Zhao SSE ‘11 Volume Quantized in Intervals The pre-trade analysis that traders conduct is a lengthy procedure, during which every trader has to go through various charts, data, and information before executing a trade. The amount of time required before executing a trade limits the frequency of trades and the ability to trade on a shorter time-frame. By building increasingly comprehensive pattern recognition functions based on historical data, we have created a model which recognizes the appearance of technical trading indicators and evaluates a security’s past performance. Based on long- and short-term price and volume trends, our model identifies different conditions for technical indicators which it applies to real-time data. Price Model Bloomberg Excel In order to automatically identify technical indicators our model: • quantizes real-time market trades in 15 second intervals • scans ~40,000 data points for relevant characteristics • checks local behavior against custom indicator criteria • records individual indicator attributes • analyzes all indicator events to generate price prediction We chose the following seven indicators based on widespread adoption, trader preferences, and suitability for modeling: 1. Triangles: When a market makes higher lows and same level highs, a triangle pattern is observed. This is indicative of an uptrend (ascending triangle). When the market makes lower highs and same level lows, this will be indicative of a downtrend (descending triangle). Pattern Matching Matlab Record indicator events Identify and Display Indicators Weighted price predictions 2. Buy and sell recommendations 3. Technical Analysis Technical analysis is one of the two important techniques used to analyze securities and make investment decisions. It can be defined as a method that forecasts the direction of future prices by studying past price and volume data. Technical analysts use charts, graphs and other tools in order to recognize patterns that can give indications of future movement. Double Top Double Bottom: The double top chart pattern looks like the letter M and predicts an uptrends. The double bottom pattern looks the letter W and occurs during downtrends. These are strong indicators of a reversal in a current trend. Head and Shoulders: This is a chart formation in which a stock’s price rises to a peak, then declines. After that, the price rises to a peak higher than the previous one and again declines. Finally, the price rises to a third peak which is lower than the second and then declines again. The second peak forms the head, and while first and third peaks comprise the shoulders. After the third peak, there will be an expected downtrend in the movement of price. Results In order to make predictions using technical analysis, analysts use technical indicators. These indicators are derived by applying formulae to the price/volume data of a security. Technical indicators can be: •Momentum-based: Determines the rate of change of a security’s price over a given time period. E.g. Relative Strength index •Volatility-based: Gives an indication of the highs, lows and the range of the price movement. E.g. Bollinger Bands •Trend-based: Gives an indication of the trends in price over time. E.g. Moving average convergence-divergence •Volume-based: Gives an indication of the direction of the security based on the volume of trades being executed. E.g. OBV Fig 1 Trendline • Created technical analysis platform which enables faster and more comprehensive use of technical indicators in technical analysis • Automated technical indicator identification allows new application of technical analysis for shorter-term analysis 4. 5. ADVISOR: Prof. Linda Zhao Special thanks to Prof. Lawrence Brown 6. DEMO TIMES: Thursday, April 21, 2011 11:00, 11:30 AM, 1:30, 2:00 PM TEAM #7 Validation A trend line is a straight line that connects two or more price points and extends into the future, and can be used to give a visual representation of the price/volume trends. Moving Average Convergence-Divergence: This indicator shows the mean price value for multiple periods. When short-term price rises significantly above long-term price, a buy signal appears and vice versa. Bollinger Bands: This indicator shows the volatility of stock prices via bands placed above and below the moving average of the stock based on local standard deviation. Relative Strength Index (RSI): This is a momentum indicator that measures the speed and change of price movements. On-Balance Volume Indicator: This indicator keeps a cumulative total of volume trends to give an indication of the momentum of the stock. We used Matlab for our model due to its ability to process large amounts of data efficiently. After determining average value for each 15 second interval, our model identifies all local maxima and minima and stores their locations. All indicators are expressed in terms of the relationships among these turning points. For example, the Triangle indicator requires a series of peaks /valleys which are within 0.4% of each other and a strong upward or downward trend in the corresponding valleys/peaks. - Minimizes lag time of algorithmic models by working with hours, not days of data - Reduces time requirement for technical analysis from hours to minutes • Information advantage over traditional rule-of-thumb technical analysis - More detailed measurements of indicators can be taken - Superior price prediction due to greater number of indicators and more information collected per indicator - Experimentally proven prediction algorithms at indicator and overall market levels • Provides improved trading experience and fits seamlessly into trader decision making process - Real-time evaluation of trading environment and new market developments


