MDM4U Practice Test (Chapter 3): Solutions
advertisement
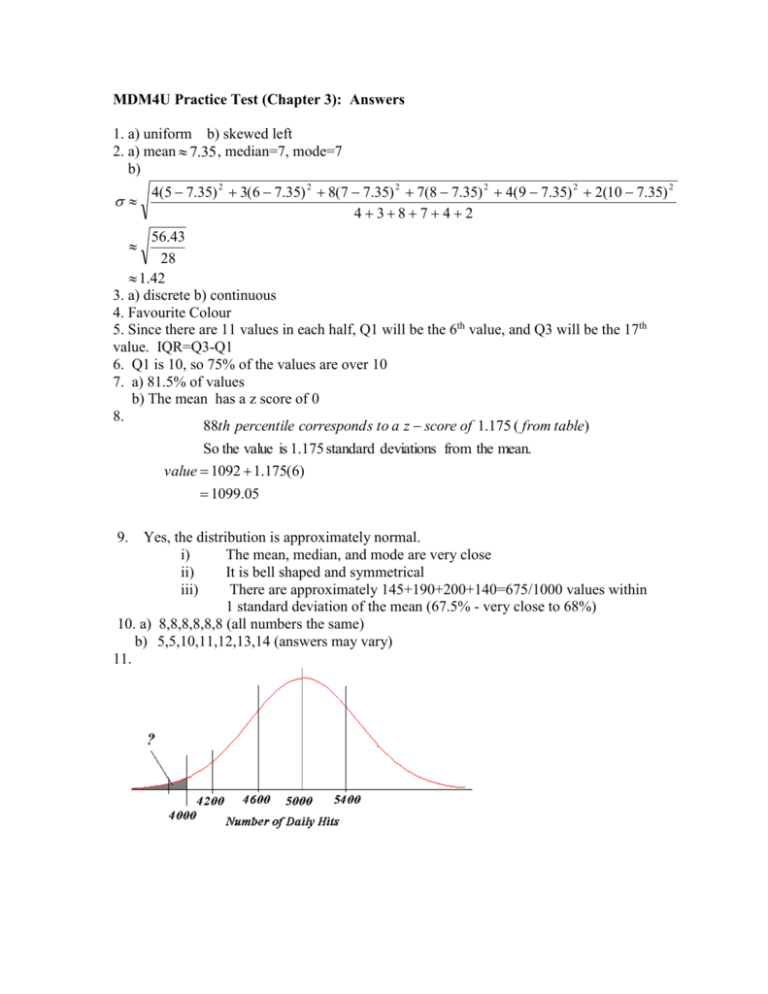
MDM4U Practice Test (Chapter 3): Answers 1. a) uniform b) skewed left 2. a) mean 7.35 , median=7, mode=7 b) 4(5 7.35) 2 3(6 7.35) 2 8(7 7.35) 2 7(8 7.35) 2 4(9 7.35) 2 2(10 7.35) 2 4 38 7 4 2 56.43 28 1.42 3. a) discrete b) continuous 4. Favourite Colour 5. Since there are 11 values in each half, Q1 will be the 6th value, and Q3 will be the 17th value. IQR=Q3-Q1 6. Q1 is 10, so 75% of the values are over 10 7. a) 81.5% of values b) The mean has a z score of 0 8. 88th percentile correspond s to a z score of 1.175 ( from table) So the value is 1.175 standard deviations from the mean. value 1092 1.175(6) 1099.05 9. Yes, the distribution is approximately normal. i) The mean, median, and mode are very close ii) It is bell shaped and symmetrical iii) There are approximately 145+190+200+140=675/1000 values within 1 standard deviation of the mean (67.5% - very close to 68%) 10. a) 8,8,8,8,8,8 (all numbers the same) b) 5,5,10,11,12,13,14 (answers may vary) 11. Calculate z - score for 4000 : 4000 - 5000 400 1000 400 2.5 z From the z - table, P( z 2.5) 0.0062 So 0.62% of days have fewer than 400 hits. In a year, this correspond s to 0.0062(365) 2.263 days, So I would expect fewer than 400 hits only 2 days per year. 12. Range=12 Bin width=2 # of bins = 6 bin frequency -10 2 12 3 34 4 56 7 78 8 910 2 1112 1 13. Let x represent his exam mark (%) 70(80) 10(72) 20( x ) 100 8200 5600 720 20 x 82 1880 20 x x 94 Therefore he must get 94% on the exam to get 82% in the course. 14. z - score for 8th percentile : z -1.4 mean - 1.4 12 (1) z - score for 69th percentile : z 0.5 mean 0.5 100 (2) Solving the system of equations : mean 12 1.4 (1) mean 100 - 0.5 (2) Substitute (1) into (2) 12 1.4 100 - 0.5 1.9 88 46.3 Now solve for mean... mean 0.5 100 (2) mean 0.5(46.3) 100 mean 76.85 The mean rainfall in April is approximat ely 76.85mm and the standard devaition is approximat ely 46.3 mm 14. Ms. Democracy could have a higher average, but a larger standard deviation (a very inconsistent class), meaning that she had more failing students. Mr. Charter could have a very consistent class with a lower average. For Example: Ms. Democacracy: N (75,252 ) P(X<50) = 15.7% failing Mr. Charter: N (70,10 2 ) P(X<50) = 2.3% failing


