This short paper
advertisement
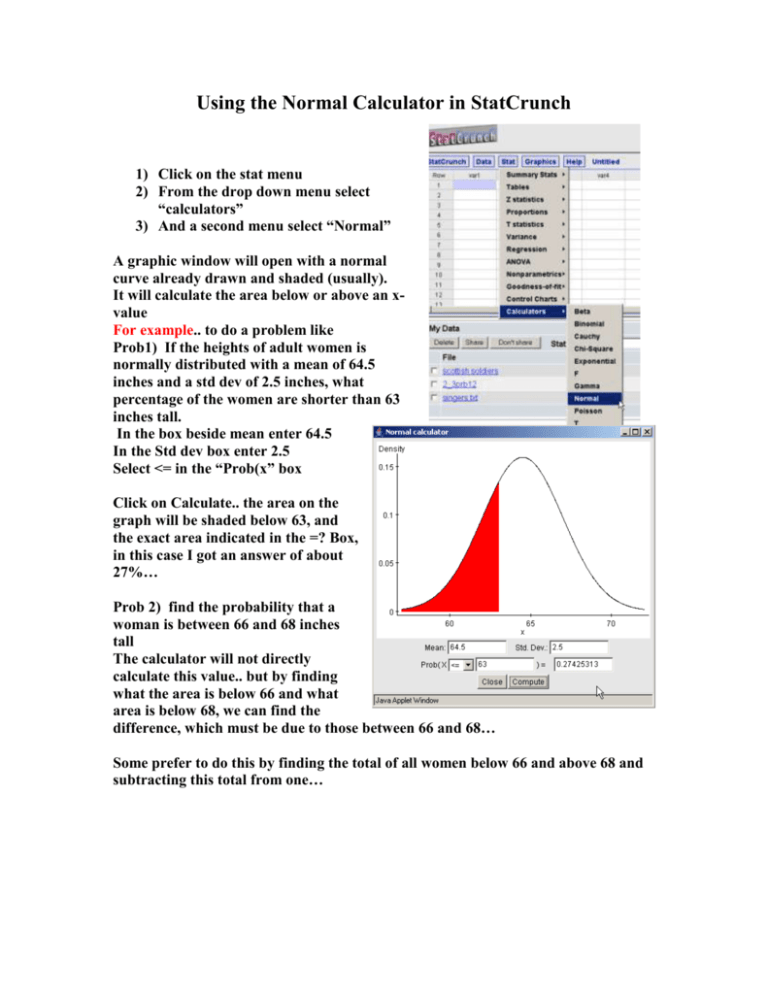
Using the Normal Calculator in StatCrunch 1) Click on the stat menu 2) From the drop down menu select “calculators” 3) And a second menu select “Normal” A graphic window will open with a normal curve already drawn and shaded (usually). It will calculate the area below or above an xvalue For example.. to do a problem like Prob1) If the heights of adult women is normally distributed with a mean of 64.5 inches and a std dev of 2.5 inches, what percentage of the women are shorter than 63 inches tall. In the box beside mean enter 64.5 In the Std dev box enter 2.5 Select <= in the “Prob(x” box Click on Calculate.. the area on the graph will be shaded below 63, and the exact area indicated in the =? Box, in this case I got an answer of about 27%… Prob 2) find the probability that a woman is between 66 and 68 inches tall The calculator will not directly calculate this value.. but by finding what the area is below 66 and what area is below 68, we can find the difference, which must be due to those between 66 and 68… Some prefer to do this by finding the total of all women below 66 and above 68 and subtracting this total from one…
