End Behavior of Polynomials
advertisement
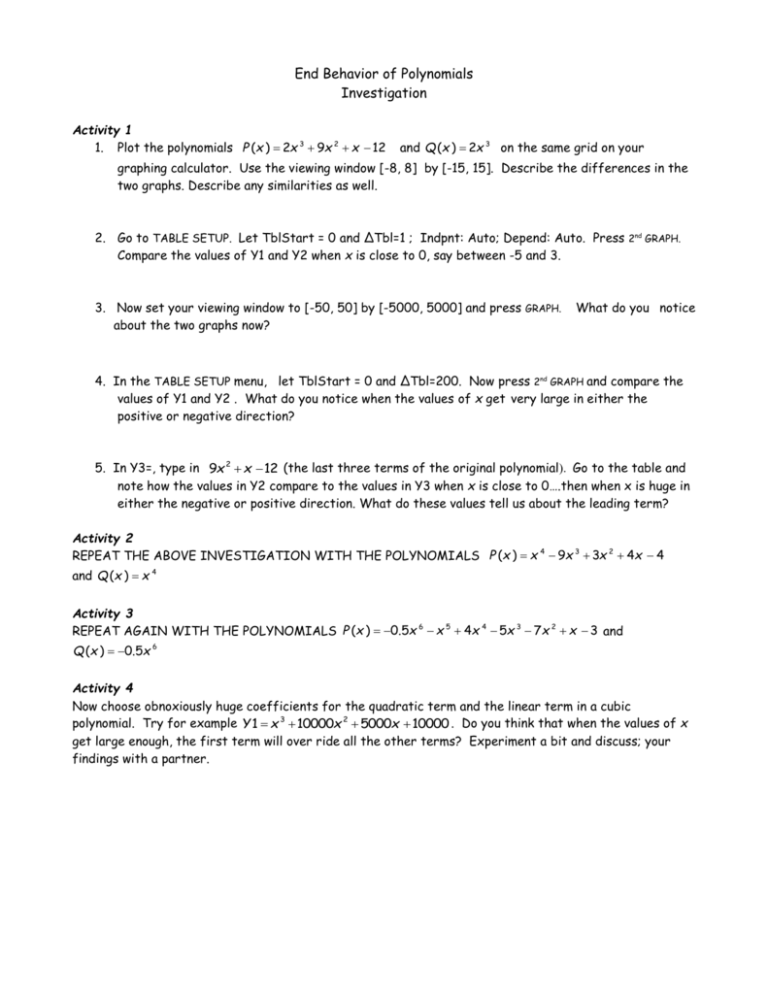
End Behavior of Polynomials Investigation Activity 1 1. Plot the polynomials P (x ) 2x 3 9x 2 x 12 and Q (x ) 2x 3 on the same grid on your graphing calculator. Use the viewing window [-8, 8] by [-15, 15]. Describe the differences in the two graphs. Describe any similarities as well. 2. Go to TABLE SETUP. Let TblStart = 0 and ΔTbl=1 ; Indpnt: Auto; Depend: Auto. Press 2nd GRAPH. Compare the values of Y1 and Y2 when x is close to 0, say between -5 and 3. 3. Now set your viewing window to [-50, 50] by [-5000, 5000] and press GRAPH. about the two graphs now? What do you notice 4. In the TABLE SETUP menu, let TblStart = 0 and ΔTbl=200. Now press 2nd GRAPH and compare the values of Y1 and Y2 . What do you notice when the values of x get very large in either the positive or negative direction? 5. In Y3=, type in 9x 2 x 12 (the last three terms of the original polynomial). Go to the table and note how the values in Y2 compare to the values in Y3 when x is close to 0….then when x is huge in either the negative or positive direction. What do these values tell us about the leading term? Activity 2 REPEAT THE ABOVE INVESTIGATION WITH THE POLYNOMIALS P (x ) x 4 9x 3 3x 2 4x 4 and Q (x ) x 4 Activity 3 REPEAT AGAIN WITH THE POLYNOMIALS P (x ) 0.5x 6 x 5 4x 4 5x 3 7x 2 x 3 and Q (x ) 0.5x 6 Activity 4 Now choose obnoxiously huge coefficients for the quadratic term and the linear term in a cubic polynomial. Try for example Y 1 x 3 10000x 2 5000x 10000 . Do you think that when the values of x get large enough, the first term will over ride all the other terms? Experiment a bit and discuss; your findings with a partner. Even and Odd Multiplicity Investigation In your graphing calculator, let Y1 (x 2)2 (x 1) . Press ZOOM 6 and look at the graph in the standard viewing window. 1. Name the zeros of the function. 2. What happens to the graph at each of these zeros? Does the graph cross or touch the x-axis? 3. Repeat #1 and #2 with Y1 (x 3)2 (x 2) , 4. Repeat #1 and #2 with Y1 (x 5)2 (x 8) , 5. Repeat #1 and #2 with Y1 (x 5)3 (x 8)2 , 6. Repeat #1 and #2 with Y1 (x 1)2 (x 4)3 ,(use viewing window [-5,5] by [-100,100] for this one 7. Repeat #1 and #2 with Y1 (x 1)4 (x 3) Predict the x-intercepts for the graphs of each of the following. Do you think the graph will cross or touch at each zero. Explain. Then check your conjecture on your graphing calculator. 8. Y1 (x 2)2 (x 3) 9. Y1 (x 1)4 (x 2)3 10. Y1 (x 3)(x 2)2 For each of the following, write a possible function rule for the graph. Check on your graphing calculator. 11. 12. 13.


