Unit 3 Syllabus Fall 2015
advertisement
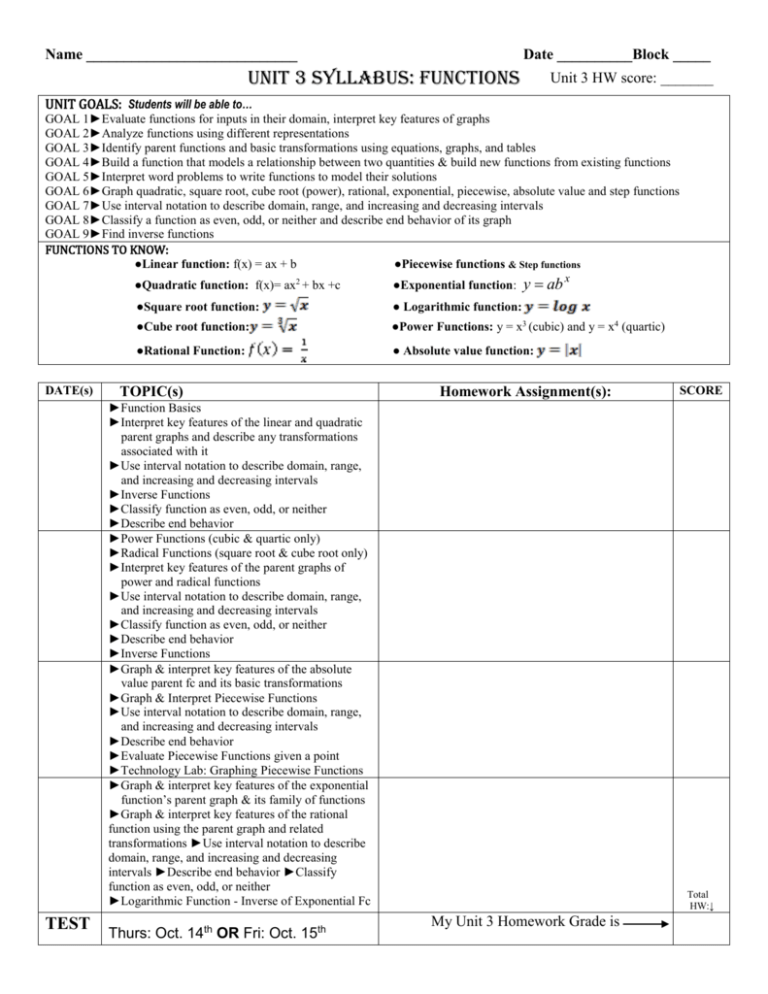
Name ____________________________ Date __________Block _____ Unit 3 Syllabus: Functions Unit 3 HW score: _______ UNIT GOALS: Students will be able to… GOAL 1►Evaluate functions for inputs in their domain, interpret key features of graphs GOAL 2►Analyze functions using different representations GOAL 3►Identify parent functions and basic transformations using equations, graphs, and tables GOAL 4►Build a function that models a relationship between two quantities & build new functions from existing functions GOAL 5►Interpret word problems to write functions to model their solutions GOAL 6►Graph quadratic, square root, cube root (power), rational, exponential, piecewise, absolute value and step functions GOAL 7►Use interval notation to describe domain, range, and increasing and decreasing intervals GOAL 8►Classify a function as even, odd, or neither and describe end behavior of its graph GOAL 9►Find inverse functions FUNCTIONS TO KNOW: ●Linear function: f(x) = ax + b ●Piecewise functions & Step functions DATE(s) y ab x ●Quadratic function: f(x)= ax2 + bx +c ●Exponential function: ●Square root function: ● Logarithmic function: ●Cube root function: ●Power Functions: y = x3 (cubic) and y = x4 (quartic) ●Rational Function: ● Absolute value function: TOPIC(s) Homework Assignment(s): ►Function Basics ►Interpret key features of the linear and quadratic parent graphs and describe any transformations associated with it ►Use interval notation to describe domain, range, and increasing and decreasing intervals ►Inverse Functions ►Classify function as even, odd, or neither ►Describe end behavior ►Power Functions (cubic & quartic only) ►Radical Functions (square root & cube root only) ►Interpret key features of the parent graphs of power and radical functions ►Use interval notation to describe domain, range, and increasing and decreasing intervals ►Classify function as even, odd, or neither ►Describe end behavior ►Inverse Functions ►Graph & interpret key features of the absolute value parent fc and its basic transformations ►Graph & Interpret Piecewise Functions ►Use interval notation to describe domain, range, and increasing and decreasing intervals ►Describe end behavior ►Evaluate Piecewise Functions given a point ►Technology Lab: Graphing Piecewise Functions ►Graph & interpret key features of the exponential function’s parent graph & its family of functions ►Graph & interpret key features of the rational function using the parent graph and related transformations ►Use interval notation to describe domain, range, and increasing and decreasing intervals ►Describe end behavior ►Classify function as even, odd, or neither ►Logarithmic Function - Inverse of Exponential Fc TEST Thurs: Oct. 14th OR Fri: Oct. 15th SCORE Total HW:↓ My Unit 3 Homework Grade is MY MATH MIDTERM IS: ________________________________________________________ Unit 3 Functions: Essential Questions Unit 3 Topics to Know: 1. Page Numbers are aligned with Algebra II textbook – Pearson 2. Domain & Range (interval notation) Parent Functions: via equations, graphs, and tables ►Abs value (p.107) ►x2 (p.194) ►x3 (p.283) ►cube root (p.417) ► x (p.415) ►1/x (p.509) 3. 4. 5. 6. How are graphs of different families of functions the same? How are they different? How can graphs be used to help you understand real-world situations? How are the graphs of functions affected when performing various operations to different aspects of the function? (i.e. transformations) OR - How are functions affected when various operations are applied to it? How do systems of similar and different functions exhibit and apply the properties of all functions? What is meant by even and odd functions? Increasing and decreasing intervals? Can you explain how to describe any transformations associated with a parent function? What are the steps to finding a function’s inverse? Describe the strategy you would use to identify the parent graph when given a transformed function. Quadratics (Chap 4), Abs Value (p.107) 7. Radical Functions (pp, 414-420): 8. ►Evaluate functions ►Identify Shifts/Translations 9. ►3 models with translations of each function – (graphs, equations, and tables) F.IF.4 Note: Focus on power (p.341) and inverse functions (pp.405-413) in Math II Increasing, decreasing, constant intervals using interval notation Write functions to describe the relationship between two quantities (word problems) Piecewise (pp.90-91) & Step Functions Standard F.IF.1 F.IF.2 F.IF.4 F.IF.5 F.IF.7b,e F.IF.8a F.IF.9 F.BF.1ab F.BF.3 A.REI.11 Standard Description Understand the concept of a function and use function notation. Understand that a function from one set (called the domain) to another set (called the range) assigns to each element of the domain exactly one element of the range. If f is a function and x is an element of its domain, then f(x) denotes the output of f corresponding to the input x. The graph of f is the graph of the equation y = f(x). Use function notation, evaluate functions for inputs in their domains, and interpret statements that use function notation in terms of a context. Interpret functions that arise in applications in terms of the context. For a function that models a relationship between two quantities, interpret key features of graphs and tables in terms of the quantities, and sketch graphs showing key features given a verbal description of the relationship. Key features include: intercepts; intervals where the function is increasing, decreasing, positive, or negative; relative maximums and minimums; symmetries; end behavior; and periodicity. Interpret functions that arise in applications in terms of the context. Relate the domain of a function to its graph and, where applicable, to the quantitative relationship it describes. For example, if the function h(n) gives the number of person-hours it takes to assemble n engines in a factory, then the positive integers would be an appropriate domain for the function. F.IF.7b Graph square root, cube root, and piecewise-defined functions, including step functions and absolute value functions. F.IF.7e Graph exponential and logarithmic functions, showing intercepts and end behavior, and trigonometric functions, showing period, midline, and amplitude. F-IF.8: a. Use the process of factoring and completing the square in a quadratic function to show zeros, extreme values, and symmetry of the graph, and interpret these in terms of a context. Analyze functions using different representations. Compare properties of two functions each represented in a different way (algebraically, graphically, numerically in tables, or by verbal descriptions). For example, given a graph of one quadratic function and an algebraic expression for another, say which has the larger maximum. F.BF.1a Determine an explicit expression, a recursive process, or steps for calculation from a context. F.BF.1b Combine standard function types using arithmetic operations. For example, build a function that models the temperature of a cooling body by adding a constant function to a decaying exponential, and relate these fcs to the model Build new functions from existing functions. Identify the effect on the graph of replacing f(x) by f(x) + k, k f(x), f(kx), and f(x + k) for specific values of k (both positive and negative); find the value of k given the graphs. Experiment with cases and illustrate an explanation of the effects on the graph using technology. Include recognizing even and odd functions from their graphs and algebraic expressions for them. Represent and solve equations and inequalities graphically. Explain why the x-coordinates of the points where the graphs of the equations y = f(x) and y = g(x) intersect are the solutions of the equation f(x) = g(x); find the solutions approximately, e.g., using technology to graph the functions, make tables of values, or find successive approximations. Include cases where f(x) and/or g(x) are linear, polynomial, rational, absolute value, exponential, and logarithmic functions.
