Name ______________________________ Class ___________________ Date __________________
Skills Worksheet
Graphing Skills
LINE GRAPHS AND RADIOMETRIC DATING
Scientists use line graphs as tools to communicate data, specifically to show how
data change over time. Line graphs make it easy to compare different sets of data
over time. For example, in radiometric dating, the absolute age of rock is
determined by comparing the relative percentages of a radioactive (parent) isotope
and a stable (daughter) isotope.
Half-life is the time it takes for half the mass of a radioactive isotope to decay into
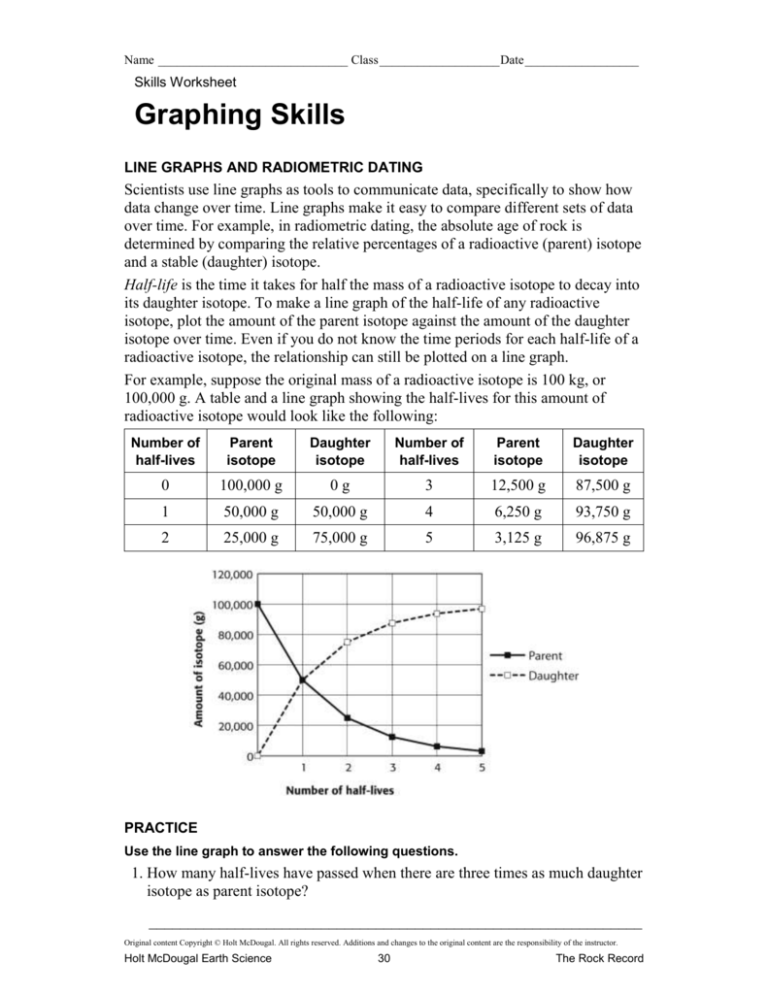
its daughter isotope. To make a line graph of the half-life of any radioactive
isotope, plot the amount of the parent isotope against the amount of the daughter
isotope over time. Even if you do not know the time periods for each half-life of a
radioactive isotope, the relationship can still be plotted on a line graph.
For example, suppose the original mass of a radioactive isotope is 100 kg, or
100,000 g. A table and a line graph showing the half-lives for this amount of
radioactive isotope would look like the following:
Number of
half-lives
Parent
isotope
Daughter
isotope
Number of
half-lives
Parent
isotope
Daughter
isotope
0
100,000 g
0g
3
12,500 g
87,500 g
1
50,000 g
50,000 g
4
6,250 g
93,750 g
2
25,000 g
75,000 g
5
3,125 g
96,875 g
PRACTICE
Use the line graph to answer the following questions.
1. How many half-lives have passed when there are three times as much daughter
isotope as parent isotope?
_______________________________________________________________
Original content Copyright © Holt McDougal. All rights reserved. Additions and changes to the original content are the responsibility of the instructor.
Holt McDougal Earth Science
30
The Rock Record
Name ______________________________ Class ___________________ Date __________________
Graphing Skills continued
2. How many grams of the parent isotope are left in the sample after three halflives?
_______________________________________________________________
3. Why is the line graph a curve instead of a straight line?
_______________________________________________________________
4. If a sample contained 94,000 g of the daughter isotopes, where on the line
graph would the sample be shown?
_______________________________________________________________
5. The table below shows the radioactive decay of a 10 kg sample of carbon-14.
Create a graph using the data below. Label the x-axis “Number of half-lives.”
Label the y-axis “Amount of isotope (g).” Plot the decay of carbon-14 in terms
of half-lives. Each half-life for carbon-14 is about 5,700 years.
Years passed
Carbon-14 (g)
Years passed
Carbon-14 (g)
0
10,000
34,200
156
5,700
5,000
28,500
312
11,400
2,500
39,900
78
17,100
1,250
45,600
39
22,800
625
51,300
20
6. About how old is a sample of bone that contains 900 g of carbon-14? Mark its
position on the line graph. How many half-lives have passed?
_______________________________________________________________
Original content Copyright © Holt McDougal. All rights reserved. Additions and changes to the original content are the responsibility of the instructor.
Holt McDougal Earth Science
31
The Rock Record

![tutorial #14 [nuclear physics and radioactivity] .quiz](http://s3.studylib.net/store/data/008407305_1-1884988a9e5162a6b7a2b0d0cf8c83c5-300x300.png)
