Crashing and Probabilities Handout and ICE 7
advertisement
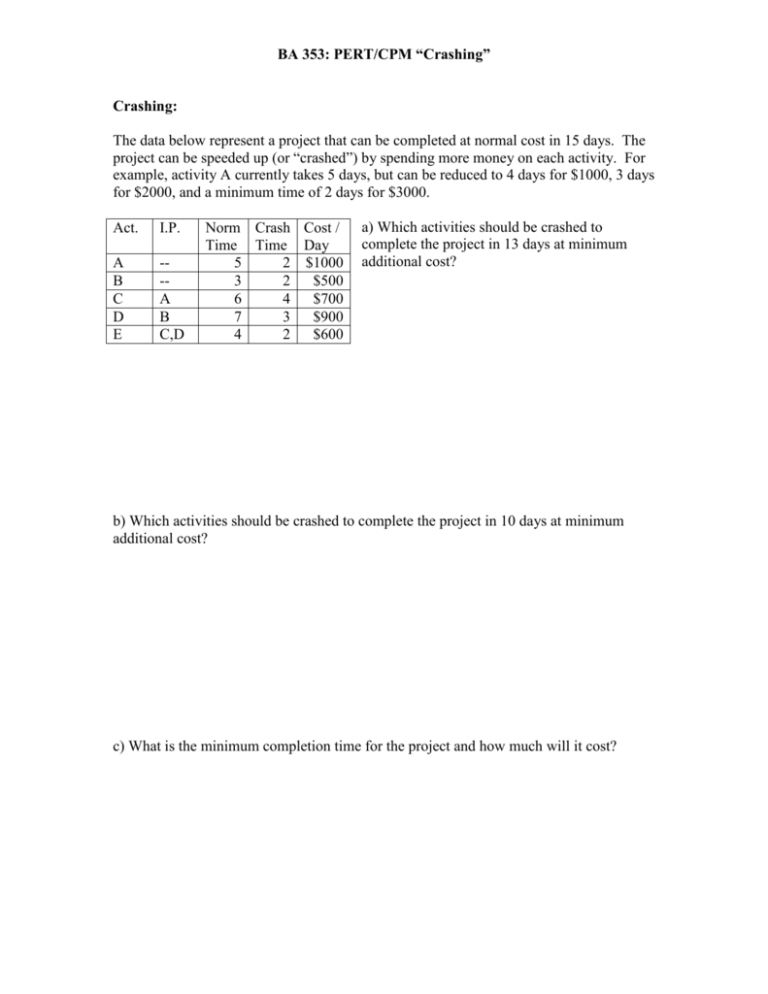
BA 353: PERT/CPM “Crashing” Crashing: The data below represent a project that can be completed at normal cost in 15 days. The project can be speeded up (or “crashed”) by spending more money on each activity. For example, activity A currently takes 5 days, but can be reduced to 4 days for $1000, 3 days for $2000, and a minimum time of 2 days for $3000. Act. I.P. A B C D E --A B C,D Norm Crash Cost / Time Time Day 5 2 $1000 3 2 $500 6 4 $700 7 3 $900 4 2 $600 a) Which activities should be crashed to complete the project in 13 days at minimum additional cost? b) Which activities should be crashed to complete the project in 10 days at minimum additional cost? c) What is the minimum completion time for the project and how much will it cost? Names _____________________________ ICE 7 1) For the project data below, determine (a) the normal project completion time, (b) how much extra it will cost to finish the project in 13 days, and (c) the minimum completion time with associated extra cost. Act. I.P. A B C D E --B B A,C Norm Crash Cost / Time Time Day 9 5 $1500 5 3 $1200 6 3 $2500 9 6 $1800 5 4 $1600 a) Normal completion time? b) Cost to crash to 13 days? c) Minimum completion time and cost? 2) For the information below, first determine how long the project will take and what the project will cost under normal conditions. Then, determine how much each additional day crashed will cost, down to the minimum completion time. Finally, fill in the table below on the right with the total cost to complete the project depending on how many days it will take to complete. [Note: For activity A, the norm cost = $2000 means that it cost $2000 to complete A in 5 days. It costs $3600 to complete A in 3 days. Thus, the cost/day for A is ($3600 - $2000)/(5 - 3) = $800. Or, in other words, we assume it would cost $2800 to complete A in 4 days.] Days Cost Act I.P. Norm Crash Norm Crash Cost/ 15 Time Time Cost Cost Day A -5 3 $2000 $3600 14 B -4 2 $1000 $1500 C A 3 2 $1500 $3000 13 D B 7 4 $3000 $6000 E B 9 5 $4000 $6000 12 F C,D 4 1 $3000 $4800 11 10 9 8 7 Probabilities: The table on the right is the data for the first PERT/CPM network we discussed in class, which had a completion time of 23 days and critical path A-D-H-J. However, we now factor in that the completion time for each activity is random with the standard deviation (SD) column. a) Estimate the chance that we’ll be done in 19 days or less. b) Estimate the chance that the project will take 25 days or more. c) With 95% certainty, when will the project be done? Act A B C D E F G H I J I.P. Time SD -6 1 -8 2 A 5 1 A 7 2 B 2 0.5 B 6 1.5 C 5 1 D, E 4 1 F 4 1.5 G, H 6 2 3) Reconsider problem 1) from the PERT/CPM Practice Networks handout. Now assume that each activity time is variable. In fact, assume that the standard deviation of each activity time is about 25% of the expected activity time. [For example, the standard deviation for Activity A, which should take 7 days, may be estimated by 25%∙7 ≈ 1.75 days.] The original problem indicated a completion time of 24 days with critical path A-D-H. Answers a) Estimate the completion time for the entire project, μT. ______ b) Estimate the standard deviation for the entire project, σT. ______ c) Estimate the probability that this project will be done in 20 days or less. ______ d) Estimate the probability that this project will take 26 days or more. ______ e) We can be 95% certain that this project will be done in how many days? ______
