ppl corporation - American Public Power Association
advertisement

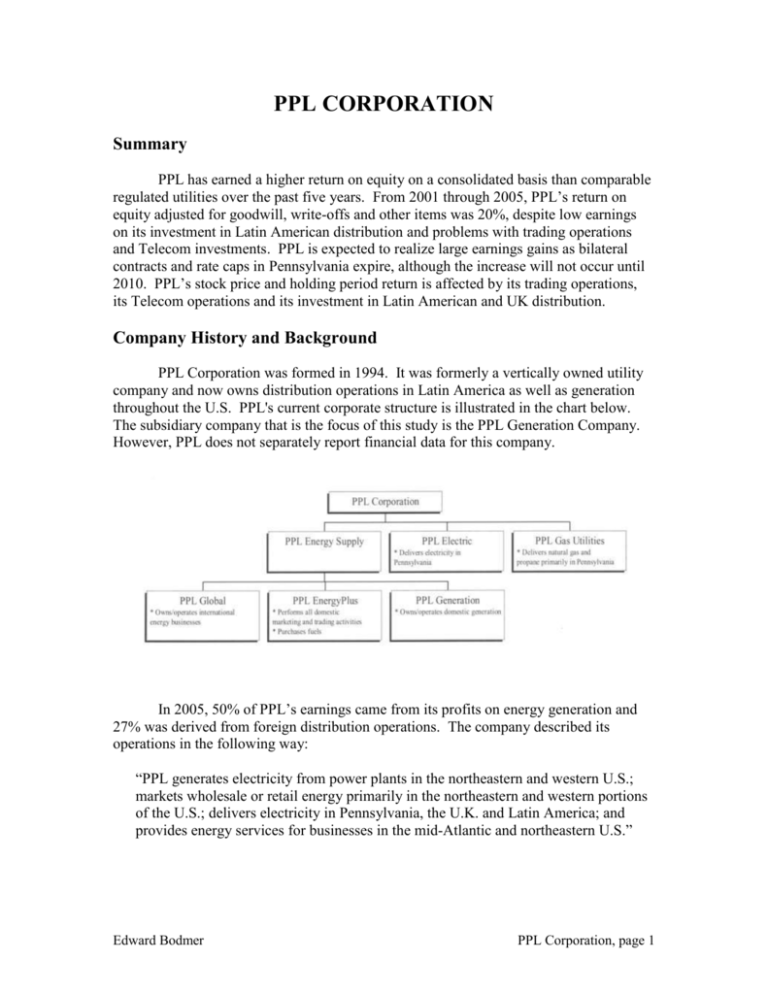
PPL CORPORATION Summary PPL has earned a higher return on equity on a consolidated basis than comparable regulated utilities over the past five years. From 2001 through 2005, PPL’s return on equity adjusted for goodwill, write-offs and other items was 20%, despite low earnings on its investment in Latin American distribution and problems with trading operations and Telecom investments. PPL is expected to realize large earnings gains as bilateral contracts and rate caps in Pennsylvania expire, although the increase will not occur until 2010. PPL’s stock price and holding period return is affected by its trading operations, its Telecom operations and its investment in Latin American and UK distribution. Company History and Background PPL Corporation was formed in 1994. It was formerly a vertically owned utility company and now owns distribution operations in Latin America as well as generation throughout the U.S. PPL's current corporate structure is illustrated in the chart below. The subsidiary company that is the focus of this study is the PPL Generation Company. However, PPL does not separately report financial data for this company. In 2005, 50% of PPL’s earnings came from its profits on energy generation and 27% was derived from foreign distribution operations. The company described its operations in the following way: “PPL generates electricity from power plants in the northeastern and western U.S.; markets wholesale or retail energy primarily in the northeastern and western portions of the U.S.; delivers electricity in Pennsylvania, the U.K. and Latin America; and provides energy services for businesses in the mid-Atlantic and northeastern U.S.” Edward Bodmer PPL Corporation, page 1 PPL Capacity PPL owns 12,274 MW of which 78% is located in PJM. More than 50% of PPL’s capacity is base load nuclear and coal capacity that is not exposed to natural gas and oil price volatility. PPL’s generating capacity is summarized in the table below: PPL Capacity Summary MW Pct of Total PJM Capacity Nuclear 2,124 18.7% Coal 3,812 33.5% Hydro 153 1.3% Gas and Oil 2,792 24.5% Total PJM 8,881 78.0% Non-PJM Total Capacity 2,507 22.0% 11,388 100.0% Historic Financial Performance PPL’s returns on equity are presented in this section. The basis for computing unadjusted returns is described in Appendix 1. The table below shows that using a variety of different approaches, PPL’s return on equity has been well above the regulated utility sample. PPL’s historic adjusted return on equity is higher than for any other PJM company. The adjusted return on equity is affected by PPL’s nuclear write-off of $878 million in 1998; its goodwill associated with acquisitions and its accumulated other comprehensive income related to derivatives. 2001 2002 2003 2004 2005 Average 169 169 486 633 360 366 232 576 734 733 9 720 698 713 691 678 737 715 Equity Reported on Balance Sheet 1,857 2,224 3,259 4,239 4,418 Less: Goodwill Net of Tax Writeoff Depreciation on Writeoff Plus: Accumulated Net Writeoff Less: Accumulated Other Comprehensive Income Adjusted Equity 878 88 790 (241) 2,888 474 878 110 768 (446) 2,964 1,068 878 132 746 (297) 3,234 1,127 878 154 724 (323) 4,159 1,070 878 176 702 (532) 4,582 Average Adjusted Equity 2,874 2,926 3,099 3,697 4,371 Average Unadjused Equity 1,935 2,041 2,742 3,749 4,329 8.74% 17.64% 26.77% 18.62% 15.66% 17.49% ROE Adjusted 22.03% 19.69% 23.23% 18.69% 16.36% 20.00% ROE - Value Line 20.80% 18.10% 20.20% 16.10% 16.50% 18.34% Return on Equity Financial Data for Computing Retuns Net Income Reported Net Income from Continuing Operations Goodwill and Other Non-Recurring Adjustments Net Income w/o Writeoffs Return on Equity Statistics ROE Unadjusted Edward Bodmer PPL Corporation, page 2 The return on invested capital and the cash flow ratios for PPL are shown in the table below. The table demonstrates that PPL’s average return of 9.58% is well above the weighted average cost of capital. Weighted average cost of capital estimates were presented in the failed Exelon/PSEG and the failed Constellation/FPL mergers. These documents estimated a weighted average cost of capital of 5.75% to 6.5%. 2001 2002 2003 2004 1,336 35% 868 1,478 35% 961 1,635 35% 1,063 1,657 35% 1,077 1,614 35% 1,049 Depreciation EBITDA 266 1,134 367 1,328 376 1,439 404 1,481 420 1,469 Net Income w/o Writeoffs Deferred Tax Cash Flow 633 283 1,182 576 340 1,283 720 352 1,448 691 434 1,529 715 232 1,367 Investment Adjusted Equity Add: Interest Bearing Debt Less: Cash and Investments Ending Invested Capital 2,888 6,604 400 9,092 2,964 7,953 273 10,644 3,234 8,647 505 11,376 4,159 7,840 628 11,371 4,582 7,435 563 11,454 Average Invested Capital 8,797 9,868 11,010 11,374 11,413 9.87% 9.74% 9.65% 9.47% 9.19% 9.58% EBITDA/Investment 12.90% 13.45% 13.07% 13.02% 12.87% 13.06% Cash Flow/Equity 61.10% 62.88% 52.82% 40.79% 31.58% 49.83% Return on Investment and Cash Flow Returns Financial Data for Computing Returns Profit and Cash Flow EBIT Tax Rate NOPLAT Rates of Return ROIC 2005 Average Outlook and Prospective Returns PPL’s prospective earnings are affected by the expiration of bilateral contracts and PJM prices as well as a number of non-recurring items. The increase in returns on the supply segment are expected to be dramatic once ratepayers have to pay for the wholesale market purchases rather than bilateral contracts (PPL uses the term provider of last resort or POLR to describe the rates that are not based on PJM market prices). Edward Bodmer PPL Corporation, page 3 PPL projects earnings per share to increase from $2.08 per share in 2005 to $2.25 per share in 2006. In subsequent years, earnings are expected to gradually increase and then hit $3.50 per share in 2010. The earnings projections made by PPL are presented in the back-up materials. Value Line projects earnings increases for PPL as follows: “PPL Corporation’s earnings should wind up much higher in 2006. Last year, a number of unusual items reduced the company’s earnings by $0.17 a share. In the first nine months of 2006, unusual items were provided by $0.06 of share earnings. PPL excludes this income from its earnings guidance of $2.25-$2.35 a share, and our estimate is at the upper end of that range. But there’s much more to PPL’s profit growth than just a swing in unusual items. The biggest factor is the 8.4% increase in the price that PPL’s power supply business charges to customers of its utility sibling, PPL Utilities which took effect at the start of the year.” Projected earnings from various sources and the returns on equity are presented in the table below. The base case comes from average earnings guidance provided by PPL and the low case is from low end of the guidance. Analyst projections of PPL’s prospective earnings are similar to the company’s estimates as shown in the table below that are extracted from YahooFinance. Details of the conversion of projected earnings into returns on equity are included in the back-up materials at the end of this section. Book Value per Share Shares 380.15 Common Equity Balance ($ Millions) Unadjusted Adjusted 4,418 4,582 Book Value Per Share Unadjusted Adjusted 11.62 12.05 Stock Price per Share End of Year 2006 End of Study Period Market Capital Market to Book Ratio Unadjusted Adjusted 35.65 34.06 $ 13,552 3.07 2.96 EPS Projection EPS Projection ($/Share) PPL Projection High Low Value Line Yahoo ROE Projection (Percentage) ROE - High Case ROE - Low Case Edward Bodmer 2006 2007 2008 2009 2010 2.30 2.20 2.35 2.33 2.40 2.30 2.35 2.64 2.53 2.90 2.78 3.50 3.50 3.50 19.0% 17.7% 18.0% 17.4% 17.4% 18.0% 20.5% 18.6% 23.4% 21.7% PPL Corporation, page 4 Holding Period Returns Holding period returns for PPL are affected by its activities in the western U.S. markets and its sales to California. PPL’s stock price increased during high power prices experienced during the California crisis and came down after it was involved in litigation associated with market power. The company discusses its involvement in the California crisis as follows: “Through its subsidiaries, PPL has made approximately $18 million of sales to the California ISO, of which $17 million has not been paid to PPL subsidiaries. Given the myriad of electricity supply problems faced by the California electric utilities and the California ISO, PPL cannot predict whether or when it will receive payment.” 17-Oct-96 PPL From: 17-October-96 Stock Price and Dividends IRR over holding period 16.8% 40.00 2.5 35.00 2 30.00 1.5 Dividends Stock Price 25.00 20.00 Stock Index Dividends EPS 1 15.00 10.00 0.5 5.00 6/17/2006 10/17/2006 2/17/2006 6/17/2005 10/17/2005 2/17/2005 6/17/2004 10/17/2004 2/17/2004 6/17/2003 10/17/2003 2/17/2003 6/17/2002 10/17/2002 2/17/2002 6/17/2001 10/17/2001 2/17/2001 6/17/2000 10/17/2000 2/17/2000 6/17/1999 10/17/1999 2/17/1999 6/17/1998 10/17/1998 2/17/1998 6/17/1997 10/17/1997 2/17/1997 0 10/17/1996 - Segment by Segment Analysis The historic profitability of PPL on a consolidated basis and the PPL Energy and the PPL Utilities segments can be evaluated from information in PPL’s 10-K reports. The gross margin for PPL and the energy supply segment has been stable as shown on the graph below. (Data for the Energy Supply segment was not available before 2001.) The graph demonstrates that most of PPL’s margin comes from the PPL Energy Supply segment. We have analyzed PPL’s return on a segment basis using available data (the adjustments for write-offs and accumulated other comprehensive income were not Edward Bodmer PPL Corporation, page 5 included in the calculations for the Energy Supply or for the Utilities subsidiaries). This analysis demonstrates that returns for the generation portion of the business have been very high even though the company has bilateral contracts. PPL’s overall returns were found to exceed returns of regulated companies. PPL Gross Margin (Revenues less Fuel and PP) 5,000 PPL Corporation 4,500 PPL Energy Supply PPL Utilities 4,000 3,500 3,000 2,500 2,000 1,500 1,000 500 0 1998 1999 2000 2001 2002 2003 2004 2005 PPL’s return on equity for the various segments is shown on the chart below. The low return on equity for the utilities segment is due to the non-US operations. If a typical utility return on equity were attributed to the PPL utilities, the consolidated return would be even higher. PPL Adjusted ROE 30.00% PPL Corporation 25.00% PPL Energy Supply PPL Utilities 20.00% 15.00% 10.00% 5.00% 0.00% PPL Corporation 1996 1997 1998 1999 2000 2001 2002 2003 2004 2005 11.99% 11.81% 10.52% 13.20% 17.04% 22.03% 19.69% 23.23% 18.69% 16.36% 20.56% 19.65% 25.35% 23.66% 18.94% 12.57% 11.12% 10.71% 13.30% 11.50% 8.17% 3.75% 2.11% 5.93% 11.17% PPL Energy Supply PPL Utilities Edward Bodmer PPL Corporation, page 6 Other measures of return for PPL show a similar pattern as the return on equity -the ROIC is higher for the Energy Supply segment and has remained strong. PPL Return on Invested Capital PPL Corporation 14.00% PPL Energy Supply PPL Utilities 12.00% 10.00% 8.00% 6.00% 4.00% 2.00% 0.00% PPL Corporation 1996 1997 1998 1999 2000 2001 2002 2003 2004 2005 8.72% 8.73% 8.71% 8.03% 9.67% 9.87% 9.74% 9.65% 9.47% 9.19% 9.58% 12.18% 10.86% 10.42% 8.47% 8.61% 8.41% 8.55% 7.91% 7.59% 5.56% 4.47% 4.01% 4.51% 7.42% PPL Energy Supply PPL Utilities Edward Bodmer PPL Corporation, page 7 PPL Back-up Materials Plant Pennsylvania Nuclear-fueled steam station Susquehanna Coal-fired steam stations Montour Brunner Island Martins Creek Keystone Conemaugh Total coal-fired Net MW Capacity 2,124 17.3% 1,540 1,483 300 211 278 3,812 31.1% 1,670 582 2,252 18.3% 451 3.7% 153 8,792 71.6% 140 295 435 3.5% Total system capacity - Pennsylvania 9,227 75.2% Total system capacity - Montana Total system capacity - Arizona Natural gas-fired station Wallingford Natural gas-fired station University Park Natural gas- and oil-fired stations Edgewood and Shoreham Total system capacity - Maine 1,259 750 10.3% 6.1% 243 2.0% 540 4.4% 159 96 1.3% 0.8% 12,274 100.0% Gas- and oil-fired steam station Martins Creek Lower Mt. Bethel Total gas- and oil-fired Combustion turbines and diesels Hydroelectric Total generating capacity Firm purchases Hydroelectric Qualifying facilities Total firm purchases Total system capacity - PPL Generation Edward Bodmer PPL Corporation, page 8 State Pennsylvania Montana Arizona Maine New York Illinois Connecticut Total Edward Bodmer Millions of kWh Percent 44,337 8,313 593 341 148 116 60 82% 15% 1% 1% 0% 0% 0% 53,908 100% PPL Corporation, page 9 Earnings Est Avg. Estimate No. of Analysts Low Estimate High Estimate Year Ago EPS Current QtrNext Qtr Current Year Next Year 38966 39057 39057 39058 0.6 0.51 2.29 2.37 5 5 7 9 0.55 0.48 2.25 2.30 0.66 0.55 2.35 2.45 0.56 0.52 2.08 2.29 Growth Est PPL Industry Sector Current Qtr. 0.071 0.088 0.035 Next Qtr. -0.019 0.092 0.113 This Year 0.101 0.102 0.086 Next Year 0.035 0.138 0.127 Past 5 Years (per annum) N/A N/A N/A Next 5 Years (per annum) 10.5% 0.0745 0.0699 Price/Earnings (avg. for comparison categories) 14.5 16.22 16.37 PEG Ratio (avg. for comparison categories) 1.38 2.18 2.34 Edward Bodmer S&P 500 0.155 0.073 0.142 0.099 N/A N/A 15.75 N/A PPL Corporation, page 10 Edward Bodmer 10/17/2006 8/17/2006 6/17/2006 4/17/2006 2/17/2006 12/17/2005 10/17/2005 8/17/2005 6/17/2005 4/17/2005 2/17/2005 12/17/2004 10/17/2004 8/17/2004 6/17/2004 4/17/2004 2/17/2004 12/17/2003 10/17/2003 Stock Price 25.00 20.00 15.00 1 10.00 0.5 5.00 0 17-Oct-03 PPL From: 17-October-03 Stock Price and Dividends IRR over holding period 23.1% 40.00 2.5 35.00 30.00 2 25.00 1.5 20.00 15.00 - Dividends 40.00 Stock Index Dividends EPS Dividends 10/17/2006 8/17/2006 6/17/2006 4/17/2006 2/17/2006 12/17/2005 10/17/2005 8/17/2005 6/17/2005 4/17/2005 2/17/2005 12/17/2004 10/17/2004 8/17/2004 6/17/2004 4/17/2004 2/17/2004 12/17/2003 10/17/2003 8/17/2003 6/17/2003 4/17/2003 2/17/2003 12/17/2002 10/17/2002 8/17/2002 6/17/2002 4/17/2002 2/17/2002 12/17/2001 10/17/2001 Stock Price 17-Oct-01 PPL From: 17-October-01 Stock Price and Dividends IRR over holding period 18.0% 2.5 35.00 30.00 2 1.5 Stock Index Dividends EPS 1 10.00 0.5 5.00 0 PPL Corporation, page 11 17-Oct-05 PPL From: 17-October-05 Stock Price and Dividends IRR over holding period 14.5% 40.00 2.5 35.00 2 30.00 1.5 Dividends Stock Price 25.00 20.00 Stock Index Dividends EPS 1 15.00 10.00 0.5 5.00 - 0 6 6 6 6 6 6 6 6 6 6 6 6 6 5 5 5 5 5 5 6 6 6 6 6 6 6 6 00 200 200 200 200 200 200 200 200 200 200 200 200 200 200 200 200 200 200 200 200 200 200 200 200 200 200 /2 / / / / / / / / / / / / / / / / / / / / / / / / / / 17 /31 /14 /28 /12 /26 1/9 /23 2/6 /20 3/6 /20 4/3 /17 5/1 /15 /29 /12 /26 /10 /24 8/7 /21 9/4 /18 0/2 /16 / 1 2 3 4 5 5 6 6 7 7 8 9 1 10 10 10 11 11 12 12 PPL EBITDA 1,600 1,400 1,200 1,000 PPL Corporation PPL Energy Supply PPL Utilities 800 600 400 200 1996 1997 1998 1999 2000 2001 2002 2003 2004 2005 PPL Generation operates its Pennsylvania and Illinois power plants in conjunction with PJM. PPL Generation's Pennsylvania power plants and PPL EnergyPlus are members of the Reliability First Corporation (RFC), the new regional reliability council that replaced the Mid-Atlantic Area Coordination Council. In Illinois, Edward Bodmer PPL Corporation, page 12 PPL's 540 MW natural gas-fired generating station is a party to the Mid-America Interconnected Network Agreement. Refer to "Pennsylvania Delivery Segment" for information regarding PJM's operations and functions and the RFC. ROE Projection Prospective ROE - High Case Dividend Payout 75% 75% 75% 75% 75% Opening Book Value Add: EPS Less: Dividend Closing Book Value 2006 12.05 2.35 1.7625 12.64 2007 12.64 2.33 1.7475 13.22 2008 13.22 2.35 1.7625 13.81 2009 13.81 2.90 2.178 14.54 2010 14.54 3.50 2.625 15.41 Average Book Value ROE 12.35 19.0% 12.93 18.0% 13.52 17.4% 14.17 20.5% 14.98 23.4% Shares Equity 380.15 4,806 380.15 5,027 380.15 5,251 380.15 5,527 380.15 5,859 65% 65% 65% 65% 65% Opening Book Value Add: EPS Less: Dividend Closing Book Value 2006 12.05 2.20 1.43 12.82 2007 12.82 2.30 1.495 13.63 2008 13.63 2.53 1.6445 14.51 2009 14.51 2.78 1.80895 15.49 2010 15.49 3.50 2.275 16.71 Average Book Value ROE 12.44 17.7% 13.23 17.4% 14.07 18.0% 15.00 18.6% 16.10 21.7% Shares Equity 380.15 4,875 380.15 5,181 380.15 5,518 380.15 5,888 380.15 6,354 Dividend Payout Edward Bodmer PPL Corporation, page 13


