Day 6 Characteristics of Poly fns 1
advertisement
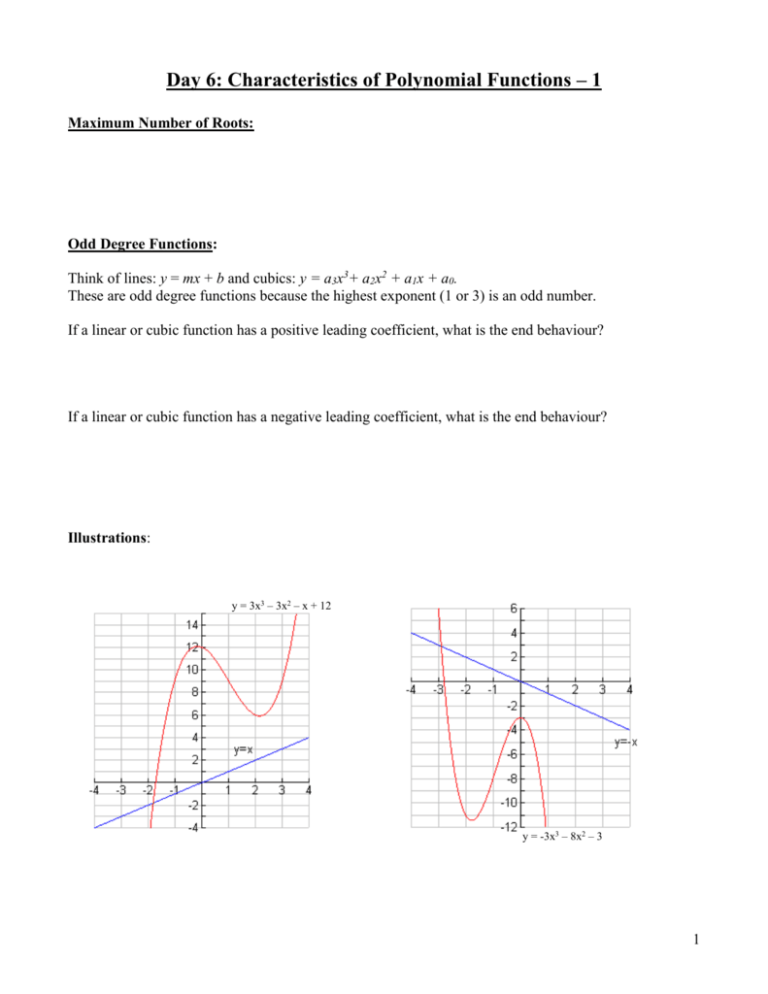
Day 6: Characteristics of Polynomial Functions – 1 Maximum Number of Roots: Odd Degree Functions: Think of lines: y = mx + b and cubics: y = a3x3+ a2x2 + a1x + a0. These are odd degree functions because the highest exponent (1 or 3) is an odd number. If a linear or cubic function has a positive leading coefficient, what is the end behaviour? If a linear or cubic function has a negative leading coefficient, what is the end behaviour? Illustrations: y = 3x3 – 3x2 – x + 12 y = -3x3 – 8x2 – 3 1 Even Degree Functions: Think of quadratic functions: y = ax2 + bx + c and quartic: y =a4x4+ a3x3+ a2x2 + a1x + a0. These are even degree functions because the highest exponent (2 or 4) is an even number. If a quadratic or quartic function has a positive leading coefficient, what is the end behavior? If a quadratic or quartic function has a negative leading coefficient, what is the end behavior? Illustrations: y = -x4 - 4x3 - 2x2 + 5x + 9 y= x2 y = 2x4 – 5x3 – 6 y = -x2 2 Example 1: Match the function to its corresponding graph. Justify your choices. g ( x) x 3 x 2 h( x) x 4 3x3 x 1 f ( x) 3x3 8x 2 7 j ( x) x 4 x3 11x 2 9 x 3 a) b) c) d) 3 Day 6 Homework: 1) Complete the following chart. Use a table of values to create the graph, if necessary. Polynomial f(x) = x function sketch f(x) = x2 f(x) = x3 f(x) = x4 Degree Type of function Domain Range End behavior 2) i) What is the greatest possible number of zeros each function could have? What information did you use to determine this? ii) State the end behaviour for each function. What information did you use to determine this? a) f ( x) 2 x3 6 x 2 4 x 1 d) p( x) 5 x 4 x 2 7 x b) g ( x) 7 x 2 3x 8 e) f ( x) x5 3x 4 x 2 6 c) h( x) 4 x 2 2 x x3 2 f) h( x) 3x 2 11x 4 9 3) Match the graphs to the equations. Given reasons for your choices. a) f(x) = -x3+3x b) g(x) = x3-3x c) h(x) = x4-3x d) j(x) = -x4 + 3x i) ii) iii) iv) 4 4) a) Each of the graphs represents a polynomial function of degree 1, 2, 3, or 4. Determine the least (smallest) possible degree of the function corresponding to each graph. Justify your answer. b) For each graph, state the sign of the leading coefficient. Justify your answer. 5
