Statistics – Final Exam Review
advertisement

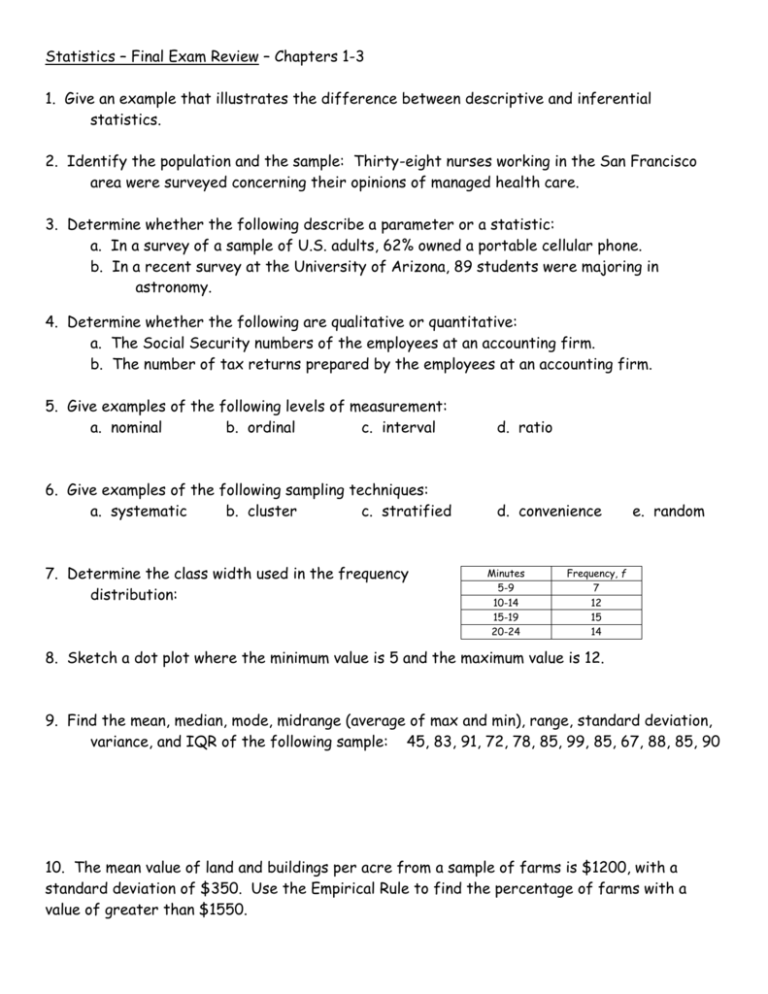
Statistics – Final Exam Review – Chapters 1-3 1. Give an example that illustrates the difference between descriptive and inferential statistics. 2. Identify the population and the sample: Thirty-eight nurses working in the San Francisco area were surveyed concerning their opinions of managed health care. 3. Determine whether the following describe a parameter or a statistic: a. In a survey of a sample of U.S. adults, 62% owned a portable cellular phone. b. In a recent survey at the University of Arizona, 89 students were majoring in astronomy. 4. Determine whether the following are qualitative or quantitative: a. The Social Security numbers of the employees at an accounting firm. b. The number of tax returns prepared by the employees at an accounting firm. 5. Give examples of the following levels of measurement: a. nominal b. ordinal c. interval d. ratio 6. Give examples of the following sampling techniques: a. systematic b. cluster c. stratified d. convenience 7. Determine the class width used in the frequency distribution: Minutes 5-9 10-14 15-19 20-24 e. random Frequency, f 7 12 15 14 8. Sketch a dot plot where the minimum value is 5 and the maximum value is 12. 9. Find the mean, median, mode, midrange (average of max and min), range, standard deviation, variance, and IQR of the following sample: 45, 83, 91, 72, 78, 85, 99, 85, 67, 88, 85, 90 10. The mean value of land and buildings per acre from a sample of farms is $1200, with a standard deviation of $350. Use the Empirical Rule to find the percentage of farms with a value of greater than $1550. 11. What is the meaning of the quartiles in a box-and-whisker plot? 12. The mean of the grades in a class is 78% with a standard deviation of 4.7%. Use z-scores to determine which grades would be considered unusual and very unusual. 13. How do you determine a simple probability? What is the range of probability? 14. Give an example of mutually exclusive events and not mutually exclusive events. 15. The probability that a randomly selected person in Summit County skis is 0.62. What is the probability that a randomly selected person does not ski? 16. Give examples of independent and dependent events. 17. Events A and B are mutually exclusive. P(A) = 0.13 and P(B) = 0.71. Find P(A or B). 18. A blood bank catalogs the types of blood, including positive or negative Rh-factor, given by donors during the last five days. The number of donors who gave each blood type is shown in the table. A donor is selected at random. a. Find the probability that the donor has type O or type A blood. b. Find the probability that the donor has type B blood or is Rh-negative. c. Find the probability that the donor has type A blood given that they are Rh-positive. Rh-factor Positive Negative Total O 156 28 184 Blood Type A B AB 139 37 12 25 8 4 164 45 16 Total 344 65 409 19. In how many ways can the letters A, B, C, D, E, and F be arranged for a six-letter security code? 20. There are four processes involved in assembling a certain product. These processes can be performed in any order. Management wants to find which order is least time consuming. How many different orders will have to be tested? Statistics – Final Exam Review – Chapters 4-6 1. Give examples of discrete and continuous variables. 2. The number of cats per household in a small town is given: Find the probability of randomly Cats 0 1 selecting a household that has less Households 1941 349 than 3 cats. 2 203 3 78 4 57 5 40 3. A sociologist surveyed households in a U.S. town. The random variable x represents the number of dependent children in the households. a. Determine the probability x 0 1 2 3 4 5 6 distribution’s missing value. P(x) 0.05 ? 0.23 0.21 0.17 0.11 0.08 b. Find the mean and standard deviation. c. Calculate the expected value. 4. A surgical technique is performed on seven patients. You are told there is a 70% chance of success. Find the probability that the surgery is successful for a. exactly five patients, b. at least five patients, and c. less than five patients. 5. Give examples of the following types of distributions: a. binomial b. geometric c. Poisson d. multinomial 6. The lengths of Atlantic croaker fish are normally distributed, with a mean of 10 inches and a standard deviation of 2 inches. An Atlantic croaker fish is randomly selected. a. Find the probability that the length of the fish is less than 7 inches. b. Find the probability that the length of the fish is between 7 and 15 inches. c. Find the probability that the length of the fish is more than 15 inches. 7. Find the z-score that has 78.5% of the distribution’s area to its right. 8. IQ test scores are normally distributed with a mean of 100 and a standard deviation of 15. Find the x-score that corresponds to a z-score of -1.57. 9. During a certain week the mean price of gasoline in California was $2.029 per gallon. A random sample of 38 gas stations is drawn from this population. a. What is the probability that x , the mean price for the sample, was between $2.034 and $2.044? Assume $0.049 . b. What prices would be considered unusual? 10. Thirty-one percent of workers in the United States are college graduates. You randomly select 50 workers and ask each if he or she is a college graduate. (Use the normal distribution to approximate the binomial distribution.) a. Find the probability that exactly 14 workers are college graduates. b. Find the probability that at least 14 workers are college graduates. c. Find the probability that fewer than 14 workers are college graduates. 11. Find the critical value z c necessary to form a confidence interval at the 85% confidence level. 12. Find the value of E, the margin of error, for c = 0.99, s = 3.0, and n = 6. 13. Construct a 90% confidence interval for the population mean . Assume the population has a normal distribution. From a random sample of 36 days in a recent year, the closing stock prices for Hasbro has a mean of $19.31 and a standard deviation of $2.37. (Interactive Data Corp.) 14. Construct a 95% confidence interval for the population mean . Assume the population has a normal distribution. In a random sample of seven computers, the mean repair cost was $100.00 and the standard deviation was $42.50. 15. In a survey of 350 people who microwave often, 55% of these people were in-favor of food irradiation to kill disease microbes. Construct a 99% confidence interval for the proportion of frequent microwave users who favor irradiation. Statistics – Final Exam Review – Chapters 7,9, and 10 1. Decide whether each confidence interval indicates that you should reject H 0 . H 0 : 54 . a. 54.5,55.5 b. 51.5,54.5 c. 53.5,56.5 2. Given H 0 : 8.5 , H a : 8.5 , and P 0.0691 . a. Do you reject or fail to reject H 0 at the 0.05 level of significance? b. Do you reject or fail to reject H 0 at the 0.10 level of significance? 3. An automotive battery manufacturer guarantees that the mean reserve capacity of a certain battery is greater than 1.5 hours. To test this claim, you randomly select a sample of 50 batteries and find the mean reserve capacity to be 1.55 hours with a standard deviation of 0.32 hour. At 0.10 , do you have enough evidence to support the manufacturer’s claim? 4. A coffee shop claims that its fresh-brewed drinks have a mean caffeine content of 80 mg/5 oz. You work for a city health agency and are asked to test this claim. You find that a random sample of 42 five-ounce servings has a mean caffeine content of 83 mg and a standard deviation of 35 mg. At 0.05 , do you have enough evidence to reject the shop’s claim? 5. A weight loss program claims that program participants have a mean weight loss of at least 10 pounds after one month. You work for a medical association and are asked to test this claim. A random sample of 30 program participants and their weight losses ( in pounds) after one month is listed below. At 0.03 , do you have enough evidence to reject the program’s claim? 5.7, 5.7, 6.6, 6.7, 7.0, 7.1, 7.9, 8.2, 8.2, 8.7, 8.9, 9.0, 9.3, 9.5, 9.6, 9.8, 10.2, 10.5, 10.6, 10.6, 11.1, 11.2, 11.5, 11.7, 11.8, 12.0, 12.7, 12.8, 13.8, 15.0 6. A computer repairer believes that the mean repair cost for damaged computers is more than $95. To test this claim, you determine the repair costs for seven randomly selected computers and find that the mean repair cost is $100 per computer with a standard deviation of $42.50. At 0.01 , do you have enough evidence to support the repairer’s claim? (Consumer Reports) 7. A medical researcher estimates that no more than 55% of U.S. adults eat breakfast every day. In a random sample of 250 U.S. adults, 56.4% say the eat breakfast every day. At 0.01, is there enough evidence to reject the researcher’s claim. (U.S. National Center for Health Statistics) 8. A doctor says the standard deviation of the lengths of stays for patients involved in a crash in which the vehicle struck a tree is 6.14 days. A random sample of 20 lengths of stay of patients involved in this type of crash has a standard deviation of 6.5 days. At 0.05 , can you reject the doctor’s claim? (National Highway Traffic Safety Admin.) 9. The ages (in years) of 11 children and the number of words in their vocabulary are given: Age Vocab 1 3 a. b. c. d. e. f. 2 440 3 1200 4 1500 5 2100 6 2600 3 1100 5 2000 2 500 4 1525 6 2500 Display the data in a scatter plot. Calculate the correlation coefficient. Make a conclusion about the type of correlation. Is the correlation significant at the 0.01 level? Find the equation of the regression line. Use the equation of the regression line to predict the vocabulary of a 3 12 year old. 10. The distribution of the time of day of roadside hazard crash deaths for a previous year is 34% - midnight to 6 am, 15% - 6 am to noon, 22% - noon to 6 pm, and 29% - 6 pm to midnight. The results of a recent study of 627 randomly selected hazard crash deaths are shown in the table. At 0.01, has the distribution changed? Frequency, f Time of Day Midnight to 6 am 224 6 am to Noon 128 Noon to 6 pm 115 6 pm to Midnight 160


