mt1part1ak_323 - WordPress.com
advertisement
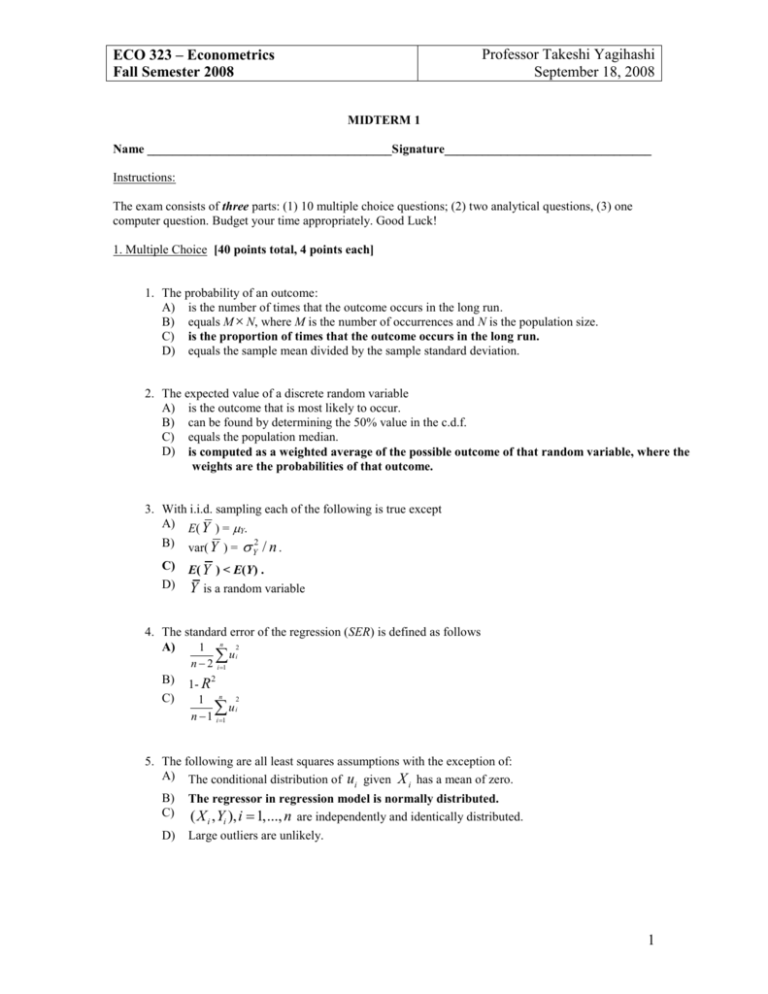
ECO 323 – Econometrics Fall Semester 2008 Professor Takeshi Yagihashi September 18, 2008 MIDTERM 1 Name _______________________________________Signature_________________________________ Instructions: The exam consists of three parts: (1) 10 multiple choice questions; (2) two analytical questions, (3) one computer question. Budget your time appropriately. Good Luck! 1. Multiple Choice [40 points total, 4 points each] 1. The probability of an outcome: A) is the number of times that the outcome occurs in the long run. B) equals M N, where M is the number of occurrences and N is the population size. C) is the proportion of times that the outcome occurs in the long run. D) equals the sample mean divided by the sample standard deviation. 2. The expected value of a discrete random variable A) is the outcome that is most likely to occur. B) can be found by determining the 50% value in the c.d.f. C) equals the population median. D) is computed as a weighted average of the possible outcome of that random variable, where the weights are the probabilities of that outcome. 3. With i.i.d. sampling each of the following is true except A) E( Y ) = Y. Y2 / n . B) var( Y ) = C) D) E( Y ) < E(Y) . Y is a random variable 4. The standard error of the regression (SER) is defined as follows A) 1 n 2 n2 B) C) u i i 1 2 1- R 1 n 2 ui n 1 i 1 5. The following are all least squares assumptions with the exception of: A) The conditional distribution of u given X has a mean of zero. i i B) C) The regressor in regression model is normally distributed. ( X i , Yi ), i 1,..., n are independently and identically distributed. D) Large outliers are unlikely. 1 ECO 323 – Econometrics Fall Semester 2008 Professor Takeshi Yagihashi September 18, 2008 6. The sample average is a random variable and A) is a single number and as a result cannot have a distribution. B) has a probability distribution called its sampling distribution. C) has a probability distribution called the standard normal distribution. D) has a probability distribution that is the same as for the Y ,..., Y i.i.d. variables. 1 n 7. The formula for the sample variance is A) 1 n 2 (Yi Y ) n 1 i 1 1 n sY2 (Yi Y )2 n 1 i 1 1 n sY2 (Yi Y )2 n 1 i 1 1 n 1 sY2 (Yi Y )2 n 1 i 1 sY B) C) D) 8. The following types of statistical inference are used throughout econometrics, with the exception of A) confidence intervals. B) hypothesis testing. C) calibration. D) estimation. 9. The normal approximation to the sampling distribution of 1 is powerful because A) many explanatory variables in real life are normally distributed. B) it allows econometricians to develop methods for statistical inference. C) many other distributions are not symmetric. 10. The OLS residuals A) can be calculated using the errors from the regression function. B) can be calculated by subtracting the fitted values from the actual values. C) are unknown since we do not know the population regression function. D) should not be used in practice since they indicate that your regression does not run through all your observations. 2 ECO 323 – Econometrics Fall Semester 2008 Professor Takeshi Yagihashi September 18, 2008 Analytical Questions [40 points total, 20 points each] Instructions: Please answer in the space provided after each question. 2. Question on conditional distribution / expectation Suppose you use a computer in the library to type your term paper and the librarian randomly assigns you a computer from those available, half of which are new and half of which are old. Let M be the number of times your computer crashes while you are writing a term paper. If M=4, you will quit and write the paper by hand crash=0 crash=1 crash=2 crash=3 crash=4 computer =old 0.35 0.065 0.05 0.025 0.01 computer =new 0.45 0.035 0.01 0.005 0.00 Joint Distributions of Computer Crashes and Computer Age What are the values for the following? Show how you derived each of the answers. a) Pr (crash=0, computer=old) b) Pr (crash=0 | computer=old) c) E (crash | computer=old) a) 0.35 b) 0.35/(0.35+0.065+0.05+0.025+0.01)=0.35/0.5=0.7 c) 0.35/0.5*0+0.065/0.5*1+0.05/0.5*2+0.025/0.5*3+0.01/0.5*4=0+0.13+0.2+0.15+0.08=0.56 3 ECO 323 – Econometrics Fall Semester 2008 Professor Takeshi Yagihashi September 18, 2008 3. Question on hypothesis testing Suppose you are interested in whether the recent college graduates earn $20/hour or not. You decide to conduct a survey to 200 former students that graduated last year. a. The null hypothesis is that the graduates earn $20/hour. State this formally in terms of μ H0: μ=0 b. The alternative hypothesis is that the college graduates earn either more or less than $20/hour. State this formally in terms of μ H0: μ≠0 c. From the survey you obtained the sample average wage of $22.64 and the sample standard deviation of $18.14. Calculate the test statistics and use the below table for testing the null hypothesis against the alternative hypothesis. What do you conclude? Significance α =10% level α =5% α=1% one sided test (>) 1.28 1.64 2.33 one sided test (<) -1.28 -1.64 -2.33 two-sided test 1.64 1.96 2.58 se=18.14/(sqrt200)=1.28 t=(22.64-20)/1.28=2.06>1.96 Thus we reject H0 4
