7th Grade Standard(s): 7.EE.3 Solve multi-step real
advertisement
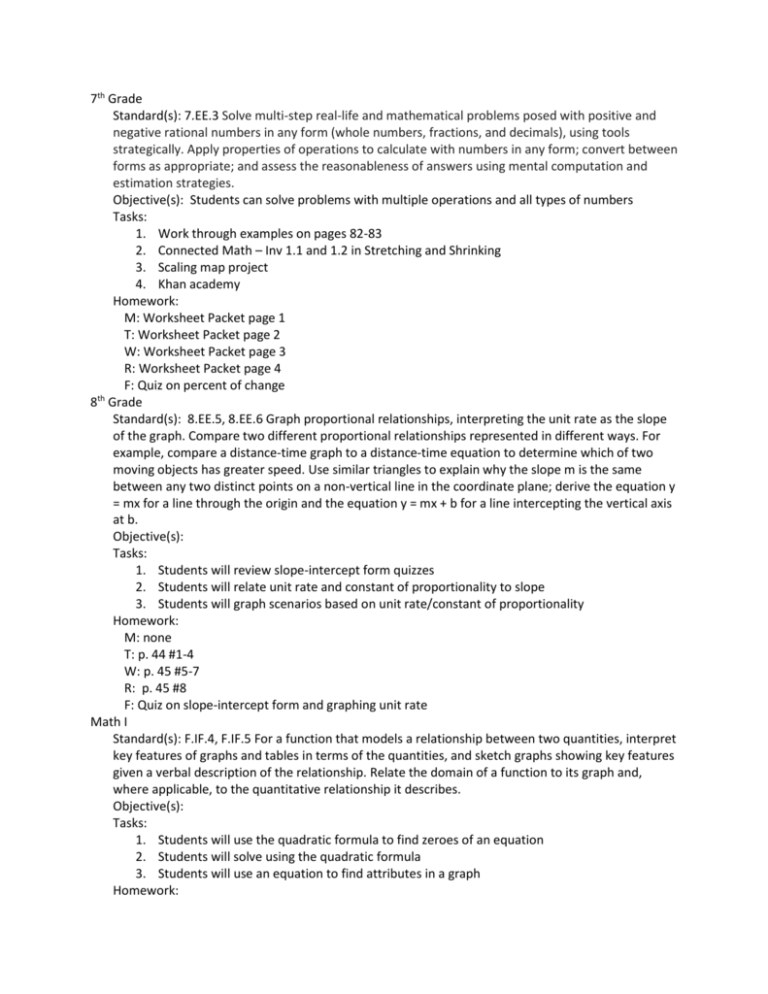
7th Grade Standard(s): 7.EE.3 Solve multi-step real-life and mathematical problems posed with positive and negative rational numbers in any form (whole numbers, fractions, and decimals), using tools strategically. Apply properties of operations to calculate with numbers in any form; convert between forms as appropriate; and assess the reasonableness of answers using mental computation and estimation strategies. Objective(s): Students can solve problems with multiple operations and all types of numbers Tasks: 1. Work through examples on pages 82-83 2. Connected Math – Inv 1.1 and 1.2 in Stretching and Shrinking 3. Scaling map project 4. Khan academy Homework: M: Worksheet Packet page 1 T: Worksheet Packet page 2 W: Worksheet Packet page 3 R: Worksheet Packet page 4 F: Quiz on percent of change th 8 Grade Standard(s): 8.EE.5, 8.EE.6 Graph proportional relationships, interpreting the unit rate as the slope of the graph. Compare two different proportional relationships represented in different ways. For example, compare a distance-time graph to a distance-time equation to determine which of two moving objects has greater speed. Use similar triangles to explain why the slope m is the same between any two distinct points on a non-vertical line in the coordinate plane; derive the equation y = mx for a line through the origin and the equation y = mx + b for a line intercepting the vertical axis at b. Objective(s): Tasks: 1. Students will review slope-intercept form quizzes 2. Students will relate unit rate and constant of proportionality to slope 3. Students will graph scenarios based on unit rate/constant of proportionality Homework: M: none T: p. 44 #1-4 W: p. 45 #5-7 R: p. 45 #8 F: Quiz on slope-intercept form and graphing unit rate Math I Standard(s): F.IF.4, F.IF.5 For a function that models a relationship between two quantities, interpret key features of graphs and tables in terms of the quantities, and sketch graphs showing key features given a verbal description of the relationship. Relate the domain of a function to its graph and, where applicable, to the quantitative relationship it describes. Objective(s): Tasks: 1. Students will use the quadratic formula to find zeroes of an equation 2. Students will solve using the quadratic formula 3. Students will use an equation to find attributes in a graph Homework: M: p. 334 #1-4 T: p. 334 #5-12 W: p. 340 #1-4 R: p. 340 #5a-d F: Quiz on sketching graphs based on verbal descriptions Math II Standard(s): Integrals and their relationship to function graphs Objective(s): Students will complete a function graphing project on graphing/design software on the laptops Tasks: 1. Use the 12 basic functions 2. Design using functions 3. Use integrals of functions to shade on a coordinate plane using geometry software Homework: M: Sketch all 12 basic functions on a sheet of paper T: Name the functions you are using in your project W: Look up integrals and find a relationship between functions and integral R: Complete project F: Quiz on functions and integrals
