Ultrasonic B-Scan
TEAS
1.6.03
-00
Related topics
Sound velocity, reflection coefficient, ultrasonic echography, A-scan, B-scan, grey-scale dis-play,
resolution, zone of focus, and image artefacts.
Principle
The fundamental principles concerning the generation of ultrasonic B-scan images (brightness
representation of the reflection amplitudes) are demonstrated with the aid of a simple test ob-ject. The
experiment is executed with an ultrasonic echoscope in the pulse-echo-mode and the object is scanned
manually. Then, the image quality and the most important image defects will be assessed.
Equipment
1
Basic Set “Ultrasonic echoscope”
13921-99
consisting of’:
1x Ultrasonic echoscope
1x Ultrasonic probe 1 MHz
1x Ultrasonic probe 2 MHz
1x Ultrasonic test block
1x Ultrasonic cylinder set
1x Ultrasonic test plates
1x Ultrasonic gel
1
Additional equipment
PC with a USB port, Windows XP or higher
Caution!
Pay close attention to the special operation and safety instructions in the manual of the ultrasonic
echoscope.
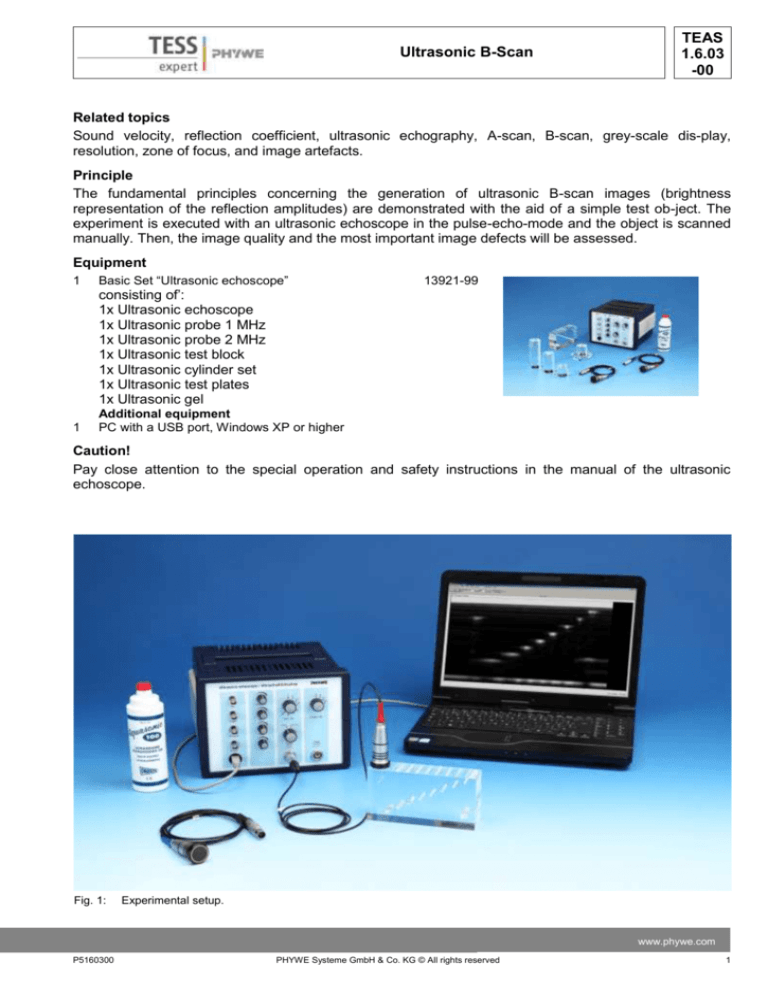
Fig. 1:
Experimental setup.
www.phywe.com
P5160300
PHYWE Systeme GmbH & Co. KG © All rights reserved
1
TEAS
1.6.03
-00
Ultrasonic B-Scan
Tasks
1. Measure the 3 edge lengths of the test block with a vernier calliper and determine the time of flight
of the sound for the various edge lengths of the test block with the aid of the measurement software.
2. Calculate the sound velocity of the test block material and switch the measurement software (A-scan
mode) to depth measurement.
3. Produce two B-scans, one with the 1 MHz probe and one with the 2 MHz probe, with the aid of the
measurement software (B-scan mode).
4. Measure the depth and width of the echoes in the resulting images.
5. Characterise the quality of the images in terms of their resolution and defects.
Set-up and procedure
Figure 1 shows the experiment set-up.
Ultrasound test block
The following illustration (Fig. 2) shows the technical drawing of the ultrasound test block with its nominal
dimensions. Figure 3 shows the names of the flaws (holes) and measurement distances.
Ultrasound gel or a water film can be used to couple the ultrasonic probes to the test block. For
producing a scan (i.e. if the probe must be moved steadily over the block surface), we recommend
applying a water film to the block surface.
Attention: Wipe the ultrasound test block and the ultrasonic probes clean immediately after they have
been used in combination with ultrasound gel. Then, clean them with water or a soap solution. Do not
use alcohol or liquids with solvents for cleaning the equipment. Avoid any mechanical damage to the
surface (scratches etc.) since it would have a negative effect on the sound contact.
Fig. 2: Dimensional drawing of the ultrasound test block
2
PHYWE Systeme GmbH & Co. KG © All rights reserved
P5160300
Ultrasonic B-Scan
Connecting the equipment
Connect the ultrasonic echoscope to a free USB
port of your computer with the aid of a USB cable.
If the software has been installed correctly, the
device will be automatically identified.
Connect the ultrasonic probes (1 MHz or 2 MHz) to
the “Reflec.” input. For pulse-echo-measurements,
the selector switch must be set to “Reflec.”.
Apply a thin water film to the block in order to
couple the ultrasonic probes to the block.
TEAS
1.6.03
-00
Fig. 3: Names of the flaws (holes) and measurement
distances
Attention: Do not use too much water for coupling since it might flow under the block and change the
reflection signal of the bottom echo (sound will be coupled out to the surface underneath the block
(table).
Software
The software is used for recording, displaying, and evaluating the data. After the start of the software,
the device and interface will be identified automatically. The main screen with the A-scan signal in the
upper area and the TGC in the lower area will be displayed. The frequency of the receiver probe and the
device settings (gain, transmitting power, reflection/transmission) will also be displayed. The
measurement cursors can be moved with the mouse, and the amplitude and time of flight can then be
read. All of the other settings can be reached via the menu or with the aid of buttons in the program
interface.
Attention: Please observe the special operating and safety instructions in the instruction manuals of the
ultrasonic echoscope.
Execution of the experiment
In order to determine the sound velocity of the block material, the lengths of all of the edges must be
measured with the vernier calliper. Then, couple the ultrasonic probe to the block with the aid of some
water or ultrasound gel. Do this in a place with as few flaws (holes) as possible. Determine the time of
flight up to the opposite surface of the object in the A-scan mode. Set the gain, including TGC and the
transmitting power, so that the echo can be detected without problems (see Fig. 4-6). At greater
distances, a higher gain must be selected because of the strong attenuation. During the measurement of
the long side, the A-scan will always include the echoes of the holes (Fig. 6). The bottom echo (reflection
at the opposite side) can be easily identified by moving the probe since it maintains its position in the Ascan.
www.phywe.com
P5160300
PHYWE Systeme GmbH & Co. KG © All rights reserved
3
TEAS
1.6.03
-00
Ultrasonic B-Scan
Fig. 4: Side 1 with an edge length of approximately 40 mm
The times of flight and the edge lengths can be used in combination with equation (1) in order to determine the sound velocity of the test block material.
Enter this value into the field “Sound Velocity” and switch the software to the depth measurement
(“Depth”). The transmission and reception settings of the echoscope must be selected so that the signal
amplitude does not overshoot even in the case of objects that are located close to the surface. For this
purpose, the TGC settings must be varied (see Fig. 7).
Fig. 5: Side 2 with an edge length of approximately 80 mm
4
PHYWE Systeme GmbH & Co. KG © All rights reserved
P5160300
Ultrasonic B-Scan
TEAS
1.6.03
-00
Fig. 6: Side 3 with an edge length of approximately 150 mm
Then, press the “B-Mode” button in order to start the software for recording a 2D brightness image (Bscan, brightness).
Place the block on its long side and couple the 1 MHz probe with a water film to one of the edges of the
block. Now, apply a thin water film along the entire surface of the block. Press the “Start” button in the
software and move the probe steadily over the block.
When the other end of the block is reached, stop the software (“Stop” button). The contrast and
Fig. 7: Settings of the software in the A-scan mode for the manual recording of a B-scan
www.phywe.com
P5160300
PHYWE Systeme GmbH & Co. KG © All rights reserved
5
TEAS
1.6.03
-00
Ultrasonic B-Scan
Fig. 8: B-mode screen prior to the start of the measurement (with the current A-scan and TGC on the right-hand side)
brightness of the recorded B-scan image can be changed with the aid of the image processing features.
The distance between the holes and the upper edge can be measured in the image with the aid of the
cursor (computer mouse).
Repeat the measurement with the 2 MHz probe and compare the quality of the images.
Theory and calculations
The known length (s) of a material and the measured time of flight (t) of the ultrasound wave can be
used to determine the sound velocity (c) with the aid of equation (1):
(1)
c
2s
(double length in the case of reflection measurements)
t
Most ultrasonic probes have a coupling and protective layer (matching layer) in front of the piezoceramic
element. This layer leads to a measurement error during the determination of the sound velocity. This
means that the measured time of flight (t) includes the time of flight in the coupling layer (t L) as well as in
the sample (tS).
This error can be eliminated by using the difference between two measurements of the same material
with different lengths (s1) and (s2) (equation (2)).
(2) c
2 s1 s 2
2 s1 s 2
2 s1 s 2
t S1 t L t S 2 t L
t1 t 2
t S1 t S 2
In a sectional ultrasound image (B-scan), the echo amplitude is displayed as a greyscale value and the
time of flight as the penetration depth. A string of several adjacent depth lines leads to the sectional
image. For this purpose, the probe must be moved lengthwise over the area of examination. The local
resolution along this scanning line results from the position of the probe or its speed of movement. A
6
PHYWE Systeme GmbH & Co. KG © All rights reserved
P5160300
TEAS
1.6.03
-00
Ultrasonic B-Scan
simple way to produce a sectional image is to move the probe slowly by hand (compound scan).
However, in this case, a precise lateral resolution is only possible with the aid of additional coordinate
acquisition systems, such as linear scanners. On the other hand, thanks to the low scanning speed,
high-quality images can be produced over extended examination areas.
The image quality is determined by the following parameters:
- Precise, coordinate-based image point transmission (scanner system)
- Axial resolution (ultrasound frequency)
- Lateral resolution (sound frequency, sound field geometry, and focus)
- Greyscale resolution (transmission power, gain, and TGC)
- Number of lines (scanning speed)
- Aberrations (acoustic shadows, multiple reflections, and movement artefacts).
The focal area of a piston-type transducer x (1st approximation for the probes that are used) results from
the probe geometry (radius R) and the wavelength of the ultrasound wave () in the material with the
sound velocity c at a frequency of the wave f:
(3)
R2
x
(4)
c
f
Results
Table 1 shows the edge lengths that were measured with the vernier calliper and the times of flight that
were measured with the echoscope (Fig. 4-6).
Table 1: Edge lengths of the test objects and times of flight
Length
Time of flight
[mm]
[µs]
S1
40.6
29.5
S2
80.0
58.4
S3
149.2
108.9
With these values, equation (2) can be used to determine the sound velocity of the material.
Table 2: Sound velocity of the test object
Measurement
Sound velocity
[m/s]
S2-S1
2,755
S3-S1
2,753
Average
2,754
Based on these calculations, the sound velocity of the acrylic glass block is 2,754 m/s and this value is
taken into consideration in the B-scan. As a result, it is possible to measure the holes directly in the
image with the aid of the cursor. Table 3 shows the distances that were measured in the B-scan
compared to the values measured with the aid of the vernier calliper.
Table 3: Distances measured in the B-scan
www.phywe.com
P5160300
PHYWE Systeme GmbH & Co. KG © All rights reserved
7
TEAS
1.6.03
-00
Ultrasonic B-Scan
Hole
1
2
3
4
5
6
7
8
9
10
11
Depth (2MHz) in mm
20.5
18.8
62.2
54.7
47.1
39.6
31.7
23.5
15.5
7.8
56
Depth (1MHz) in mm
-
19.9
62.9
55.3
48
40.5
32.6
24.4
16.4
8.9
57.1
17.5
60.8
53.5
45.9
38.3
30.4
22.3
14.3
6.3
54.8
Vernier calliper in mm 19.3
The measurement with the vernier calliper is performed directly at the upper edge of the hole. This point
is too small for the ultrasound wave so that a medium signal of the hole surface is measured. The axial
resolution that has been improved with the frequency is clearly visible. The 2 MHz values are much
closer to the values that were determined with the vernier calliper.
The compound scanning method enables the representation of the test object with a high image quality.
Since the probe is moved by hand, movement artefacts are the biggest problem in terms of the lateral
resolution. Figures 9 and 10 show the B-scan images that were produced with 1 MHz probe and with the
2 MHz probe, respectively.
Fig. 9: B-scan image produced with the 1 MHz probe, measuring time 10 seconds, image not processed
8
PHYWE Systeme GmbH & Co. KG © All rights reserved
P5160300
TEAS
1.6.03
-00
Ultrasonic B-Scan
Fig. 10: B-scan image produced with the 2 MHz probe, measuring time 10 seconds, image not processed
Of the upper 5 holes of the inclined group (hole diameter: 3 mm), the third hole from the top (hole no. 8)
is displayed with the best lateral resolution since the zone of focus of the 1 MHz probe lies approximately
at 2.3 cm. The zone of focus of the 2 MHz probe lies a bit deeper so that, in this case, the highest lateral
resolution can be found at the fifth hole from the top (hole no. 6). Table 3 shows several values for
estimating the zone of focus in accordance with equation (3).
Table 4: Zone of focus of the probes
Probe
Radius
Frequency
Sound velocity
Wavelength
Zone of focus
[mm]
[MHz]
[m/s]
[mm]
[cm]
1 MHz
8
1
2,754
2.75
2.3
2 MHz
8
2
2,754
1.38
4.6
The two small holes can only be distinguished with the 2 MHz probe since it has a considerably higher
axial resolution.
The bright bottom echo is interrupted by several darker sections since the flaws that are located above it
cast an acoustic shadow. Measurements particularly under the big flaw in the lower right-hand corner are
no longer possible since this area remains free from sound.
Fig. 11 shows the B-scan image with modified contrast settings. The same result would be provided by
an overdriven amplifier. The hole that is closest to the surface (hole no. 10) can no longer be discerned
in the initial echo of the probe.
In the case of the manual scan, the steadiness of the movement plays an important role. This method is
susceptible to lateral resolution and general measuring errors. Figure 12 shows a measurement that was
performed with irregular scanning speed. The representation of the distances between the holes on the
right-hand side is incorrect.
www.phywe.com
P5160300
PHYWE Systeme GmbH & Co. KG © All rights reserved
9
TEAS
1.6.03
-00
Ultrasonic B-Scan
Fig. 11: B-scan image with a strongly overshooting signal
Fig. 12: B-scan image produced with irregular probe movement
10
PHYWE Systeme GmbH & Co. KG © All rights reserved
P5160300

![Jiye Jin-2014[1].3.17](http://s2.studylib.net/store/data/005485437_1-38483f116d2f44a767f9ba4fa894c894-300x300.png)


