Biology I Notes
advertisement
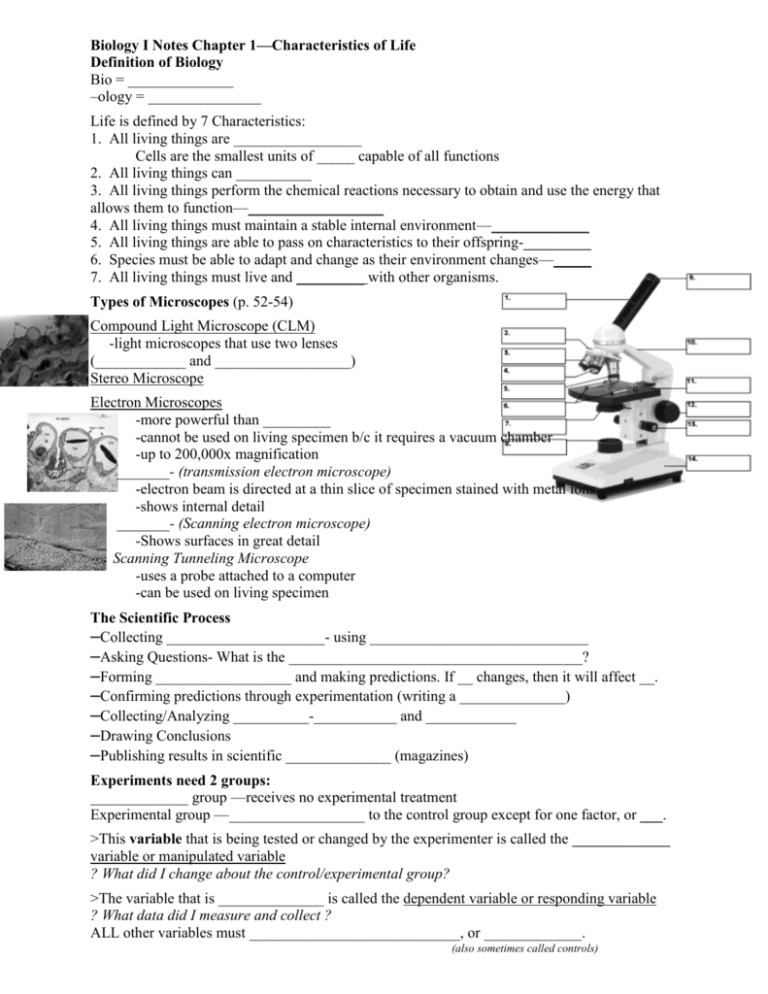
Biology I Notes Chapter 1—Characteristics of Life Definition of Biology Bio = ______________ –ology = _______________ Life is defined by 7 Characteristics: 1. All living things are _________________ Cells are the smallest units of _____ capable of all functions 2. All living things can __________ 3. All living things perform the chemical reactions necessary to obtain and use the energy that allows them to function—__________________ 4. All living things must maintain a stable internal environment—_____________ 5. All living things are able to pass on characteristics to their offspring-_________ 6. Species must be able to adapt and change as their environment changes—_____ 7. All living things must live and _________ with other organisms. Types of Microscopes (p. 52-54) Compound Light Microscope (CLM) -light microscopes that use two lenses (____________ and __________________) Stereo Microscope Electron Microscopes -more powerful than _________ -cannot be used on living specimen b/c it requires a vacuum chamber -up to 200,000x magnification _______- (transmission electron microscope) -electron beam is directed at a thin slice of specimen stained with metal ions -shows internal detail _______- (Scanning electron microscope) -Shows surfaces in great detail Scanning Tunneling Microscope -uses a probe attached to a computer -can be used on living specimen The Scientific Process –Collecting _____________________- using _____________________________ –Asking Questions- What is the _______________________________________? –Forming __________________ and making predictions. If __ changes, then it will affect __. –Confirming predictions through experimentation (writing a ______________) –Collecting/Analyzing __________-___________ and ____________ –Drawing Conclusions –Publishing results in scientific ______________ (magazines) Experiments need 2 groups: _____________ group —receives no experimental treatment Experimental group —__________________ to the control group except for one factor, or ___. >This variable that is being tested or changed by the experimenter is called the _____________ variable or manipulated variable ? What did I change about the control/experimental group? >The variable that is ______________ is called the dependent variable or responding variable ? What data did I measure and collect ? ALL other variables must ____________________________, or _____________. (also sometimes called controls) Why do I need constants? Other ___________ could affect the results, so we must control those by keeping them ____________________. We want to see ____________________ _______________________without other factors interfering. Procedure • 3 or more __________________________ steps answering the question. • Someone could repeat the experiment _____________________as you did. • How did you: – change the _________________? – Measure the ________________? – Hold other variables __________________? Table • Needs these items: – IV with _________ – ______with units – Place to record ________________ – Periods of _________________ shown if needed Draw the examples from the slide into your notes here. *Choose the one that best displays the data. Presenting Scientific Data Line Graphs •Best for data that changes with ___________ (continuous) •x-axis contains the _____________ variable •y-axis contains the ______________ variable Bar Graphs •Useful when comparing data for several _______________ items •Set-up is the same as a line graph Rules for graphing •Always label the axes •Always include a unit of measure •Always include a title •Number scales must be consistent TITLE: The effect of (the IV) on (the DV) •_________ ________ •Dependent or Responding variable – _______ •Manipulated or Independent variable- ______ •What is the: •IV? •DV? •Title? •Interval on the x axis? •Interval on the y axis? “When there’s a key, it’s the ______!” ? What is the: IV? DV? Variable on the x axis? Variable on the y axis? Title? Unit on the x axis? Unit on the y axis? What group does the triangular data represent? Conclusion •Analyze data (mean, median, mode) if needed •Restate hypothesis and support or refute it using DATA •Identify sources of error and explain effect on results •Make proposals for future investigations
