cep740day4noteshandout.2002.revised

D:\726984122.doc Page 1 of 5
One-Way ANOVA Example From
Introductory Notes
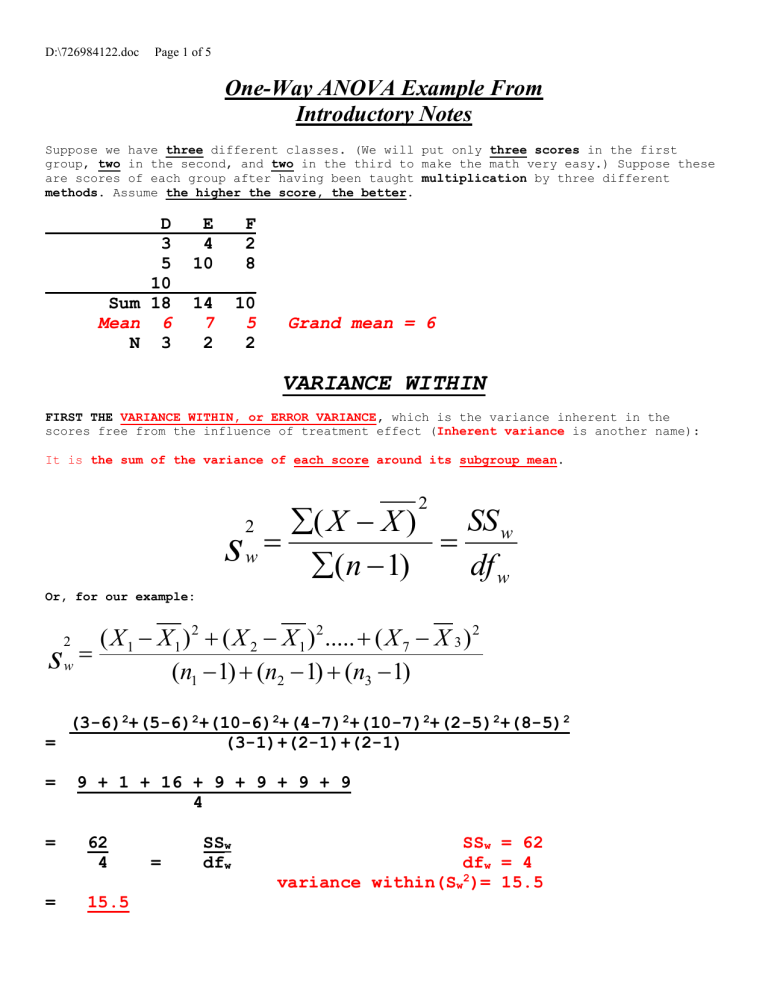
Suppose we have three different classes. (We will put only three scores in the first group, two in the second, and two in the third to make the math very easy.) Suppose these are scores of each group after having been taught multiplication by three different methods . Assume the higher the score, the better .
D E F
3 4 2
5 10 8
10 _
Sum 18 14 10
Mean 6 7 5 Grand mean = 6
N 3 2 2
VARIANCE WITHIN
FIRST THE VARIANCE WITHIN, or ERROR VARIANCE , which is the variance inherent in the scores free from the influence of treatment effect ( Inherent variance is another name):
It is the sum of the variance of each score around its subgroup mean . s
2 w
( X
( n
X
1 )
)
2
SS w df w
Or, for our example: s
2 w
( X
1
X
1
)
( n
1
2
(
1 )
X
2
( n
2
X
1
)
1 )
2
.....
( n
3
( X
1 )
7
X
3
)
2
(3-6) 2 +(5-6) 2 +(10-6) 2 +(4-7) 2 +(10-7) 2 +(2-5) 2 +(8-5) 2
= (3-1)+(2-1)+(2-1)
= 9 + 1 + 16 + 9 + 9 + 9 + 9
4
= 62 SS w
SS w
= 62
4 = df w df w
= 4 variance within(S w
2 )= 15.5
= 15.5
D:\726984122.doc Page 2 of 5
VARIANCE BETWEEN
NOW BETWEEN VARIANCE , which is inherent + treatment variance, OR THE SUM OF THE WAY THE
SUBGROUP MEANS VARY AROUND THE GRAND MEAN : s b
2
n ( X k
1
X )
2
SS b df b
Or, for our example: s
2 b
n ( X
1
X )
2 n ( X k
2
1
X )
2 n ( X
3
3(6-6) 2 + 2(7-6) 2 + 2(5-6) 2
3-1
X )
2
4 SS b
2 = df b
SS b df b
=4
=2 variance between=2
= 2
D:\726984122.doc Page 3 of 5
TOTAL VARIANCE
NOW TOTAL VARIANCE, in which we treat all scores as if they belong to a single big group made up of all the scores.
This is the variance that is the way each individual score varies around the grand mean .
Here are the calculations: s t
2
( X
N
1
X ) 2
SS t df t
=(3-6) 2 +(5-6) 2 +(10-6) 2 +(4-6) 2 +(10-6) 2 +(2-6) 2 +(8-6) 2
7-1
= 66 SS t
6 = df t
SS t
= 11.00 df t
=66
=6 total variance=11
D:\726984122.doc Page 4 of 5
Summary of Results
SO, SS within = 62 df within = 4
SS between = 4 df between = 2
SS total = 66 df total = 6
So, the source table is as follows:
SOURCE SS df MS F p between 4.00 2 2.00
Within 62.00 4 15.50
Total 66.00 6
In ANOVA, tradition dictates that we call a variance a MEAN SQUARE, rather than a
variance. ( MS stands for “ MEAN SQUARE ” and is “ the mean of the squared deviations ,” the
VARIANCE in other words._
To compare the two variance estimates, we use them to calculate a ratio .
We take the variance between (MS Between) and divide by the variance within (MS Within) , and the result is called the F ratio .
To do so for our problem:
s 2 b
F = s 2 w
If F is significant , we reject the null hypothesis of mu1=mu2=mu3 .
If it is significant, at LEAST 2 means are different . We DON’T KNOW WHICH TWO. COULD BE
ALL THREE ARE DIFFERENT .
So, in terms of the source table above, remember that tradition has us call VARIANCE another term: MEAN SQUARE .
So to calculate the F ratio for our data:
MS b
F = MS w or, in this case:
__2__
F = 15.5
F = .13
If we are doing this ANOVA by hand, we check the significance of this F ratio by going to the F table to get the critical F value , or
F crit
D:\726984122.doc Page 5 of 5
If our OBTAINED F of .13 is equal to or greater than the critical F from the table, the test is significant, we reject the null hypothesis, and we conclude that at least one pair of means differ.
How do we look up the critical F in the table?
Enter the table with df for numerator (the between MS , which is 2 ) and the denominator
(the within MS, which is 4 ) .
The critical values from the table are where the two converge - 6.94
(.05 level) and 18
(.01 level) .
Since our calculated F is far below these critical values, we decide there are no significant differences in the three means .
We conclude that these means all came from the same population . We have NO EVIDENCE that any of our three methods are superior to any of the others.
We finish our SOURCE TABLE like this:
SOURCE SS df MS F p
Between 4.00 2 2.00 .129 n.s.
Within 62.00 4 15.50
Total 66.00 6 _


