Generating Data from Prob. Model
advertisement

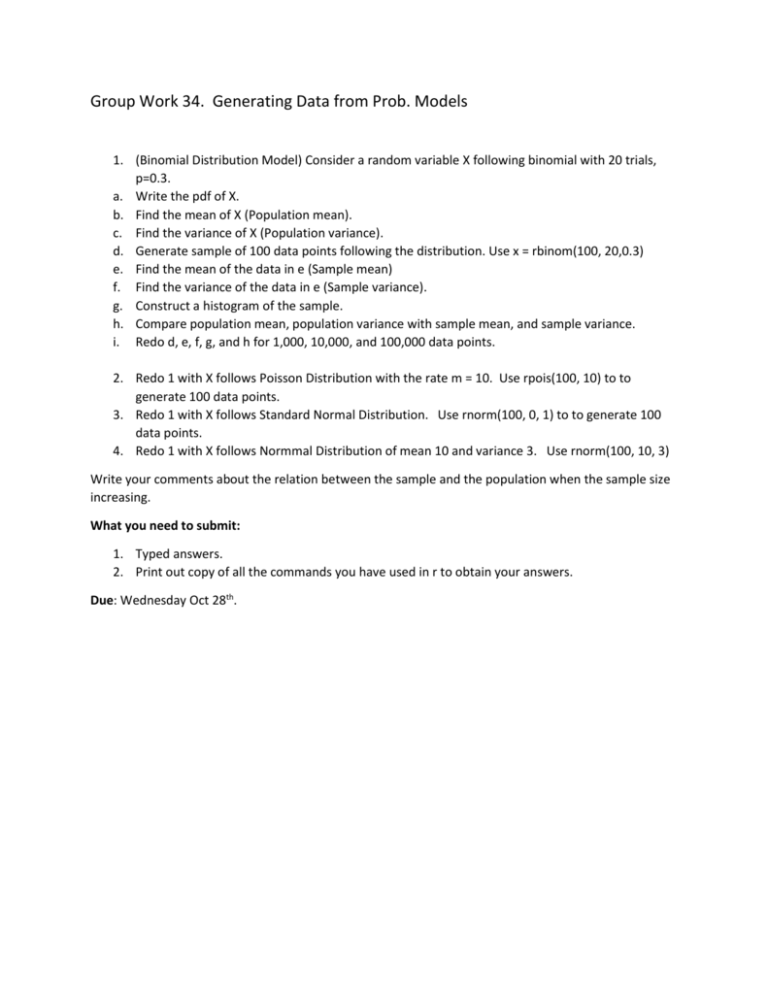
Group Work 34. Generating Data from Prob. Models 1. (Binomial Distribution Model) Consider a random variable X following binomial with 20 trials, p=0.3. a. Write the pdf of X. b. Find the mean of X (Population mean). c. Find the variance of X (Population variance). d. Generate sample of 100 data points following the distribution. Use x = rbinom(100, 20,0.3) e. Find the mean of the data in e (Sample mean) f. Find the variance of the data in e (Sample variance). g. Construct a histogram of the sample. h. Compare population mean, population variance with sample mean, and sample variance. i. Redo d, e, f, g, and h for 1,000, 10,000, and 100,000 data points. 2. Redo 1 with X follows Poisson Distribution with the rate m = 10. Use rpois(100, 10) to to generate 100 data points. 3. Redo 1 with X follows Standard Normal Distribution. Use rnorm(100, 0, 1) to to generate 100 data points. 4. Redo 1 with X follows Normmal Distribution of mean 10 and variance 3. Use rnorm(100, 10, 3) Write your comments about the relation between the sample and the population when the sample size increasing. What you need to submit: 1. Typed answers. 2. Print out copy of all the commands you have used in r to obtain your answers. Due: Wednesday Oct 28th.


