Document
advertisement
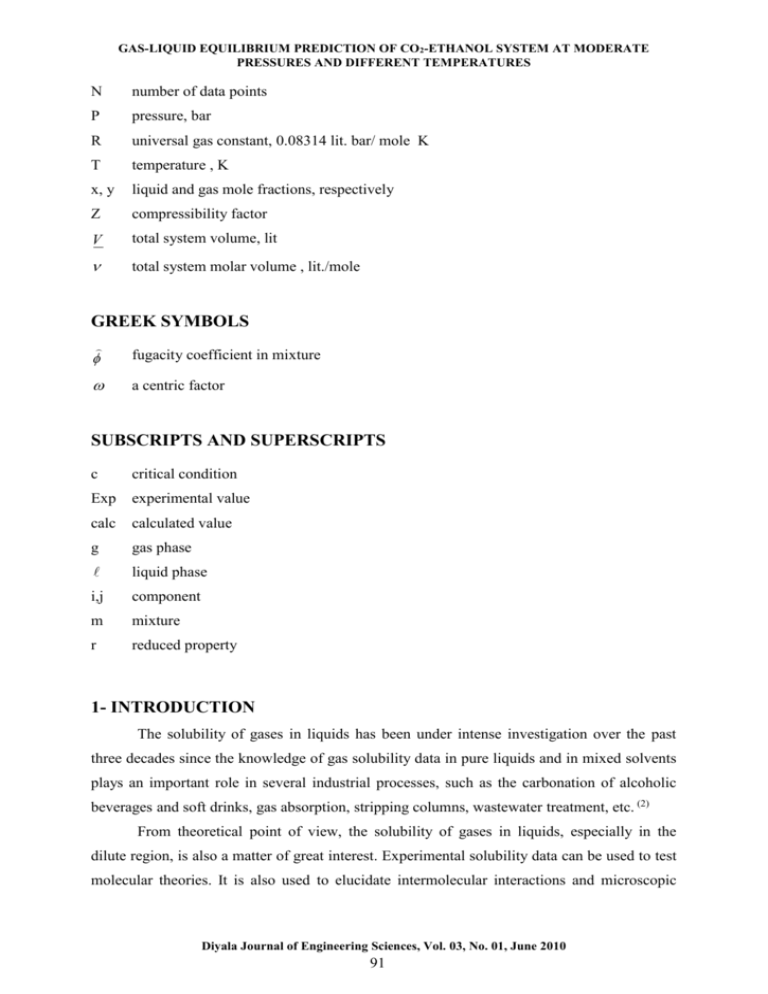
GAS-LIQUID EQUILIBRIUM PREDICTION OF CO2-ETHANOL SYSTEM AT MODERATE PRESSURES AND DIFFERENT TEMPERATURES N number of data points P pressure, bar R universal gas constant, 0.08314 lit. bar/ mole K T temperature , K x, y liquid and gas mole fractions, respectively Z compressibility factor V total system volume, lit total system molar volume , lit./mole GREEK SYMBOLS fugacity coefficient in mixture a centric factor SUBSCRIPTS AND SUPERSCRIPTS c critical condition Exp experimental value calc calculated value g gas phase liquid phase i,j component m mixture r reduced property 1- INTRODUCTION The solubility of gases in liquids has been under intense investigation over the past three decades since the knowledge of gas solubility data in pure liquids and in mixed solvents plays an important role in several industrial processes, such as the carbonation of alcoholic beverages and soft drinks, gas absorption, stripping columns, wastewater treatment, etc. (2) From theoretical point of view, the solubility of gases in liquids, especially in the dilute region, is also a matter of great interest. Experimental solubility data can be used to test molecular theories. It is also used to elucidate intermolecular interactions and microscopic Diyala Journal of Engineering Sciences, Vol. 03, No. 01, June 2010 91 GAS-LIQUID EQUILIBRIUM PREDICTION OF CO2-ETHANOL SYSTEM AT MODERATE PRESSURES AND DIFFERENT TEMPERATURES structure. According to Wilhelm et al(1)., the advantages of low-pressure gas solubility over high-pressure equilibrium data relies on the fact that inaccuracies introduced by possible necessary semi-empirical relations (for example, for the partial molar volume of solute at infinite dilution in the solvent) have essentially no effects on the final results and the thermodynamic treatment is much facilitated by well-defined assumptions.(2) Accurate thermodynamic data such as volumetric properties and phase equilibria of pure compounds and mixtures (i.e.CO2 + alkanes, CO2 + alkanols) are of great significance in the chemical, oil and biotechnology areas, and for the development and validation of thermodynamic models. In this context, it is especially important to know the global phase behavior of systems within the range of working pressures and temperatures.(3) Dalmolin et al. (2) . Studied the gas solubility data and Henry’s constants for carbon dioxide in pure water and ethanol and in their mixtures. The experiments were performed in the temperature range of 288–323 K, up to 6 atm in pure solvents and at various ethanol– water mixture compositions. Elizalde-Solis et al.(3) measured the vapor–liquid equilibria for CO2 + alkanol systems. Equilibrium measurements for the CO2 + 1-propanol system were performed from 344 to 426 K. For the case of the CO2 + 2-propanol system, measurements were made from 334 to 443 K, and for the CO2 + 1-butanol were obtained from 354 to 430K. Minqiang Hou et.al.(4) Studied the solubility of CO2 in polyethylene glycol200 (PEG200, PEG with an average molecular weight of 200 g/ mol), 1-pentanol, and1-octanol. Elizalde and Galicia-Luna,(5). measured the solubility of thiophene in CO2 and in CO2 + 1-propanol mixtures. Vapor–liquid equilibria (VLE) data of binary mixtures were fitted to the Peng–Robinson equation of state (EOS) with classical mixing rules. Chemical plants are never truly at steady state. Feed and environmental disturbances, heat exchanger fouling, and catalytic degradation continuously upset the conditions of a smooth running process. The transient behavior of the process system is best studied using a dynamic simulation tool like HYSYS. With dynamic simulation , you can confirm that the plant can produce the desired product in a manner that is safe and easy to operate. Dynamic analysis provides feedback and improves the steady state model by identifying specific areas in a plant that have difficulty achieving the steady state objectives. In HYSYS, the dynamic analysis of a process system can provide insight into the process system when it is not possible with steady state modeling(6). The HYSYS dynamic model shares the same physical property packages as the steady Diyala Journal of Engineering Sciences, Vol. 03, No. 01, June 2010 92 GAS-LIQUID EQUILIBRIUM PREDICTION OF CO2-ETHANOL SYSTEM AT MODERATE PRESSURES AND DIFFERENT TEMPERATURES state model. The dynamic model simulates the thermal, equilibrium, and reactive behaviour of the chemical system in a similar manner as the steady state model. By using a degrees of freedom approach, calculations in HYSYS are performed automatically. HYSYS performs calculations as soon as unit operations and property packages have enough required in formation(6). The design of the HYSYS interface is consistent, if not integral, with this approach to modeling. Access to information is the most important aspect of successful modeling, with accuracy and capabilities accepted as fundamental requirements(7). In modeling operations, HYSYS uses a Degrees of Freedom approach which increases the flexibility with which solutions are obtained. For most operations , you are not constrained to provide information in a specific order , or even to provide a specific set of information(7). In the present work, theoretical results is obtained using mathematical model for SRKEOS and PR-EOS for different mixing rules. The effect of mixing rules on theoretical results is found by comparing theoretical and experimental data. The results for SRK-EOS and PR-EOS for CO2(1)-ethanol(2) at moderate pressure and different temperature is compared with the experimental data obtained by Dalmolin, et sl.(2), then after these results are compared with that obtained from simulation program (HYSYS) using same equations of state and two mixing rules. 2- EQUATION OF STATE Cubic equations of state in fact is the simplest equation capable of representing both liquid and vapor behavior. Yet it must be not complex to present excessive numerical or analytical difficulties in application. (8) . Table (1) shows the general forms of SRK-EOS, and PR-EOS. Replacing ν in the general form of SRK-EOS, and PR-EOS in term of ZRT/P, gives the cubic equation of compressibility factor as shown in Table (2), where Z is the compressibility factor of the liquid mixture and may be calculated from the cubic equation by an iteration method such as Newton-Raphson method. The useful relation for finding fugacity coefficients(11) is, 1 ln ˆi = RT P RT dV ln Z v ni V T , v , nj …..(1) When the SRK-EOS is introduced into Eq. (1), the following closed-form for fugacity coefficient is obtained in the liquid phase, Diyala Journal of Engineering Sciences, Vol. 03, No. 01, June 2010 93 GAS-LIQUID EQUILIBRIUM PREDICTION OF CO2-ETHANOL SYSTEM AT MODERATE PRESSURES AND DIFFERENT TEMPERATURES ln ˆi = b bi ( Z 1) ln Z 1 m bm v a m RTb m bi 2 b a m m j b xi aij ln 1 m v …..(2) Introducing PR-EOS into Eq. (1) gives the following closed-form expression for fugacity coefficient is obtained in the liquid phase, b b ln ˆi = i ( Z 1) ln Z 1 m bm v am 2.828RTb m bi 2 b a m m j bm 1 2 . 414 v xi a ij ln 1 0.414 bm v (3) The fugacity coefficients of the components in the gas phase are also calculated with Eqs.(2,3) with, yi and all the (SRK, PR) a and b values for the gas replacing their corresponding terms. Most of simple equations of state are evolved from the van der Waal's mixing rules with or without modifications and the mixing rules for equation of state calculate the mixture parameters am and bm for the equation of state according to the one-fluid mixing rules (Eqs. 4 and 5) and the only difference between them is the combining rule that determines how the cross coefficients aij and bij are calculated. n n i j n n i j a m xi x j aij …..(4) and bm xi x j bij …..(5) Equations for three mixing rules using in this work are listed on Table (3). 3- RESULTS AND DISCUSSION Theoretical solubility of CO2 in ethanol is calculated using SRK-EOS and PR-EOS with different mixing rules. Calculations included the mole fraction of CO2 in liquid phase (x) and the mole fraction of CO2 in vapor phase (y). Each equation of state includes one or more mixing rules. Calculated data of mole fraction of CO2 in liquid phase are compared with experimental data obtained by Dalmolin, et al.(2) while the comparison of data concerning mole fraction of CO2 in gas phase is not performed since there is no experimental data available in literature. Adjustable parameter (k12) is obtained from experimental data by fitting these data using SRK-EOS and PR-EOS. Adjustable parameter (L12) which is used in MR3 is found by Diyala Journal of Engineering Sciences, Vol. 03, No. 01, June 2010 94 GAS-LIQUID EQUILIBRIUM PREDICTION OF CO2-ETHANOL SYSTEM AT MODERATE PRESSURES AND DIFFERENT TEMPERATURES trail and error. Acceptable values of (k12, L12) that values which gives minimum mean absolute deviation (%MAD) which is calculated by the following equation: % MAD 100 xexp . xcalc. N …..(6) where N is the number of data points. The steps of the calculations and the computer program in basic language are described in flow chart below. Adjustable parameter used in MR1 and MR2 are the same used in simulation program HYSYS. Table (4) includes the values of k12, and L12. The values of adjustable parameter k12 in MR2 and MR3 increased as the temperature is increased, for the tow equation of state (SRK, PR). The values of L12 in MR3 decreased with the temperature increased. The values of MAD for all mixing rules at different temperatures using SRK, PR EOS, and HYSYS for CO2-ethanol system are lists on Table5. The results shown graphically on Figs (2-13). These Figures indicated that the mixing rules MR3 gave %MAD smaller than the mixing rules MR1 and MR2 for SRK, PR -EOS. Thus, the MR3 with two adjustable parameter k12 and L12 can be used to calculate the gasliquid equilibrium of CO2 (1)-ethanol (2) at moderate pressures and different temperatures adequately. It is obvious that there is good agreement between calculated data using SRK and PR EOS for MR3 and experimental data. This means that the two equations of state can be used to calculate gas-liquid equilibrium of CO2 (1)-ethanol (2) system. Regarding the results obtained from fitting of the experimental data which are compared with the results obtained from the simulation on HYSYS program using MR1 and MR2, it is found that there is an exact matching at 11 bar or less, whereas a small deviation of 4*10-4 - 2*10-4 % is realized at operating pressure of 11-19 bar. It is worth to mention that the results obtained from BASIC program, especially at low and medium pressure is better than that of simulation on HYSYS program. 4- CONCLUSOINS 1. It is possible to collate gas-liquid equilibrium of CO2 – ethanol system using PR and SRK-EOS with the mixing rules of two adjustable parameters. 2. Mixing rule MR3 includes two adjustable parameter k12 and L12 can be employed to find the gas -liquid equilibrium data of CO2 (1)-ethanol (2) at moderate pressures and Diyala Journal of Engineering Sciences, Vol. 03, No. 01, June 2010 95 GAS-LIQUID EQUILIBRIUM PREDICTION OF CO2-ETHANOL SYSTEM AT MODERATE PRESSURES AND DIFFERENT TEMPERATURES different temperatures since it gives good agreement compared with the other mixing rules. 3. It is acceptable to use MR2 that contain one adjustable parameter k12 to calculate gas liquid equilibrium data of CO2 (1)-ethanol (2) at moderate pressures and different temperatures since it gives good agreement. 4. The adjustable parameter k12, increase with increase the temperature, note that the increment is very slight compare with the increases of the temperature in this system. 5. In this system the adjustable parameter L12, decrease with increase the temperature. 5- REFERENCES 1. E. Wilhelm, R. Battino, and R.J. Wilcock, Chem. Rev. 1977, vol. 77, pp:219–262. 2. I. Dalmolin, E. Skovroinski, A. Biasi, M.L. Corazza, C. Dariva, and J. Vladimir Oliveira; 2006, "Solubility of carbon dioxide in binary and ternary mixtures with ethanol and water". Fluid phase Equilibria, vol.245, pp:193-200. 3. Octavio Elizalde-Solis, Luis A. Galicia-Luna, and Luis E. Camacho-Camacho; 2007 "High-pressure vapor–liquid equilibria for CO2 + alkanol systems and densities of ndodecane and n-tridecane" Fluid phase Equilibria, vol.259, pp:23-32. 4. Minqiang Hou, Shuguang Liang, Zhaofu Zhang, Jiyuan Song, and Tao Jiang, Buxing Han.;2007, "Determination and modeling of solubility of CO2 in PEG200 + 1pentanol and PEG200 + 1-octanol mixtures" Fluid phase Equilibria, vol.258, pp:108114. 5. O. Elizalde-Solis, and L.A. Galicia-Luna.; 2005, "Solubility of thiophene in carbon dioxide and carbon dioxide + 1-propanol mixtures at temperatures from 313 to 363K" Fluid phase Equilibria, vol.230, pp:51-57. 6. Hyprotech Ltd.; 2002. Dynamic Modeling, HYSYS 3. pp:1-3. 7. Hyprotech Ltd.; 2002. Operations Guids, HYSYS 3.pp:1-3. 8. J. M. Smith, H. C.,Van Ness, and M. M. Abbott; 2005. Introduction to Chemical Engineering Thermodynamics, 7th Edn., McGraw. Hill Book Company, Cha.3, pp:90 9. Soave, G, 1972; "Equilibrium constants from a modified Redlich-Kwong equation of state" Chem.Eng.Science, vol.27, pp:1197-1203. 10. Peng, D.-Y., and Robinson, D.B; 1976, "A new two-constant equation of state" Ind. Eng. Chem. Fundamen., vol.15, pp:59-64. Diyala Journal of Engineering Sciences, Vol. 03, No. 01, June 2010 96 GAS-LIQUID EQUILIBRIUM PREDICTION OF CO2-ETHANOL SYSTEM AT MODERATE PRESSURES AND DIFFERENT TEMPERATURES 11. Walas, S. M., 1985. Phase Equilibria in Chemical Engineering. Butterworth Publishers, USA. 12. Adachi, Y., and Sugie, H. A; 1986. New Mixing Rule - Modified Conventional Mixing Rule. Fluid Phase Eq., vol.28, pp:103. Table (1):- General form for SRK-EOS, and PR-EOS(11) SRK- EOS P PR-EOS RT a (v b) v (v b) a 0.42747 P R 2 Tc2 Tr , Pc b 0.08664 RT a (v b) v (v b) b(v b) a 0.45724 RTc Pc R 2 Tc2 Tr , Pc b 0.0778 ()0.5 = 1+ (1-Tr0.5)(0.48508 + 1.55171 - RT c Pc ()0.5 = 1+ (1-Tr0.5)(0.37464 + 1.5422 - 0.156132) 0.26992) Table (2):- Cubic equation of compressibility factor for SRK-EOS, and PR-EOS(11) SRK-EOS PR-EOS Z3 - Z2 + (A-B - B2)Z- AB = 0 Z3 - (1 - B)Z2 + (A-2B - 3B2)Z- (AB - B2 - B3) = 0 P aP 0.42747 r2 , 2 2 R T Tr P bP B 0.08664 r RT Tr P aP 0.45724 r2 , 2 2 R T Tr P bP B 0.07780 r RT Tr A A Diyala Journal of Engineering Sciences, Vol. 03, No. 01, June 2010 97 GAS-LIQUID EQUILIBRIUM PREDICTION OF CO2-ETHANOL SYSTEM AT MODERATE PRESSURES AND DIFFERENT TEMPERATURES Table(3):- Mixing Rules Equations. No Adjustable Mixing rules parameters 2 n n a m ( xi a i0.5 ) and bm x i bi i i a ij a i a j 1- van der Waal's mixing rules (MR1)(11) n n n i j i k12=0 a m xi x j aij and bm x i bi 2- Modified van der Waal's mixing rules (MR2)(11 ) aij (1 k ij )(ai a j ) k12=value. 0.5 n n n n i j i j a m xi x j aij and bm xi x j bij 3- Quadratic mixing rules (MR3)(12) with aij (1 k ij )(ai a j ) 0.5 bij bi b j 2 k12 =value , L12 value. and (1 Lij ) Table (4):- Values of Adjustable Parameters Obtained from Fitting with PR,SRK-EOS MR3 MR2 MR Ref. 1 L12 k12 k12 T (K) k12 CO2-ethanol PR-EOS 1 1 1 1 1 -0.015 0.1029395 0.1029395 0 288 -0.0225 0.1058132 0.1058132 0 298 -0.0435 0.1132868 0.1132868 0 308 -0.538 0.1306247 0.1306247 0 323 CO2-ethanol SRK-EOS 1 -0.014 0.09770131 0.0977013 0 288 1 -0.0214 0.1007727 1 0 298 1 -0.0393 0.1086598 0.1007727 0 308 1 -0.523 0.1271771 0.1086598 0 323 0.1271771 Diyala Journal of Engineering Sciences, Vol. 03, No. 01, June 2010 98 GAS-LIQUID EQUILIBRIUM PREDICTION OF CO2-ETHANOL SYSTEM AT MODERATE PRESSURES AND DIFFERENT TEMPERATURES Table (5):- %MAD Between the Experimental and Predicted Mole Fraction Solubility of CO2 in Ethanol with Different Mixing Rules Ref. MR3 MR2 MR1 T (K) CO2-ethanol PR-EOS 1 3.306*10-5 3.93*10-3 2.727 288 1 5.282*10-6 5.23*10-3 2.3946 298 1 3.231*10-6 6.9622*10-3 1.984 308 1 4.698*10-6 3.304*10-3 1.2363 323 CO2-ethanol HYSYS PR-EOS 1 - 3.5*10-4 2.593 288 1 - 1.9710-2 2.4018 298 1 - 4.110-2 2.135 308 1 - 2.37110-2 1.684 323 CO2-ethanol SRK-EOS 1 8.451*10-5 4.498*10-3 2.409 288 1 6.219*10-6 5.152*10-3 2.213 298 1 6.034*10-6 6.478*10-3 1.765 308 1 4.027*10-6 3.022*10-2 1.110 323 CO2-ethanol HYSYS SRK-EOS 1 - 1.92*10-2 2.33 288 1 - 3.72*10-2 2.16 298 1 - 5.43*10-2 1.93 308 1 - 1.36*10-2 1.37 323 Diyala Journal of Engineering Sciences, Vol. 03, No. 01, June 2010 99 GAS-LIQUID EQUILIBRIUM PREDICTION OF CO2-ETHANOL SYSTEM AT MODERATE PRESSURES AND DIFFERENT TEMPERATURES Start Input N, T, Tc1, Tc2, Pc1, Pc2, W3, W4, R T = T + 273.15 Calculate a1, a2, b1, b2 Print T, a1, a2, b1, b2, k12, L12 Loop for Pressure 1 to 19 step 2 Subroutine to calculate compressibility factor at vapor phase ZV Calculate a12, am, bm , A, B Calculate Fugacity coefficient ( ) , Fugacity (FV), and Mole Fraction of CO2 at vapor phase (YC1) Subroutine to calculate compressibility factor at liquid phase ZL Calculate Fugacity coefficient ( ) ,Fugacity (FL), Mole Fraction of CO2 at liquid phase (XC) Print ZL, XC, ZV, YC1 End Calculation of compressibility factor (Z) Fig. (1):- The steps of computer program in basic language Diyala Journal of Engineering Sciences, Vol. 03, No. 01, June 2010 100 20 20 18 18 16 16 14 14 12 12 PR SRK Hysys SRK Hysys PR P bar P bar GAS-LIQUID EQUILIBRIUM PREDICTION OF CO2-ETHANOL SYSTEM AT MODERATE PRESSURES AND DIFFERENT TEMPERATURES 10 10 8 8 6 6 Exp 288 k PR k12=0 SRK k12=0 Hysys SRK Hysys PR 4 4 2 2 0 0 0 0.1 0.2 0.3 0.9 0.4 0.95 1 Fig. (2):- phase composition diagram of CO2-ethanol system at 288K using MR1 20 20 18 18 16 SRK 14 Hysys PR Hysys SRK 14 12 12 Pbar p bar PR 16 10 10 8 8 6 6 Exp 288 k PR k12=0.1029395 SRK k12=0.09770131 Hysys SRK Hysys PR 4 4 2 2 0 0 0 0.05 0.1 0.15 0.9 0.2 0.95 1 Fig. (3):- phase composition diagram of CO2-ethanol system at 288K using MR2 20 20 18 18 16 14 14 12 12 P bar P bar PR SRK 16 10 8 10 8 6 6 Exp 288 k PR k12,l12 4 4 SRK k12,l12 2 2 0 0 0 0.05 0.1 0.15 0.2 0.9 0.95 Fig.(4):- phase composition diagram of CO2-ethanol system at 288K using MR3 Diyala Journal of Engineering Sciences, Vol. 03, No. 01, June 2010 101 1 20 20 18 18 16 16 14 14 12 12 PR SRK Hysys SRK Hysys PR P bar P bar GAS-LIQUID EQUILIBRIUM PREDICTION OF CO2-ETHANOL SYSTEM AT MODERATE PRESSURES AND DIFFERENT TEMPERATURES 10 10 8 8 6 6 Exp 298 k PR k12=0 SRK K12=0 SRK Hysys PR Hysys 4 2 4 2 0 0 0.05 0.1 0.15 0.2 0.25 0 0.3 0.9 0.95 1 Fig. (5):- phase composition diagram of CO2-ethanol system at 298K using MR1 20 20 18 18 16 16 SRK 14 14 Hysys PR 12 12 PR Pbar P bar Hysys SRK 10 10 8 8 6 6 4 Exp 298 k 4 PR K12=0.1058132 SRK K12=.1007727 2 2 SRK Hysys PR Hysys 0 0 0 0.05 0.1 0.9 0.15 0.95 1 Fig. (6):- phase composition diagram of CO2-ethanol system at 298K using MR2 20 18 18 16 16 14 14 12 12 PR SRK P bar p bar 20 10 8 10 8 6 6 Exp 298 k 4 4 PR k12,l12 SRK k12,l12 2 2 0 0 0 0.05 0.1 0.15 0.9 0.95 Fig. (7):- phase composition diagram of CO2-ethanol system at 298K using MR3 Diyala Journal of Engineering Sciences, Vol. 03, No. 01, June 2010 102 1 GAS-LIQUID EQUILIBRIUM PREDICTION OF CO2-ETHANOL SYSTEM AT MODERATE PRESSURES AND DIFFERENT TEMPERATURES 20 20 18 PR 18 Hysys SRK 16 16 Hysys PR 14 14 12 P bar 12 P bar SRK 10 10 8 8 6 6 4 EXP 308 k PR k12=0 SRK k12=0 Hysys SRK Hysys PR 4 2 2 0 0.85 0 0 0.05 0.1 0.15 0.2 0.25 0.9 0.95 1 Fig.(8):- phase composition diagram of CO2-ethanol system at 308K using MR1 20 18 18 16 16 14 14 12 12 PR SRK Hysys SRK P bar P bar 20 10 Hysys PR 10 8 8 6 6 EXP 308 k 4 4 PR K12=0.1132868 SRK k12=0.1086598 Hysys SRK 2 2 Hysys PR 0 0 0 0.02 0.04 0.06 0.08 0.1 0.8 0.12 0.85 0.9 0.95 1 20 20 18 18 16 16 14 14 12 12 P bar P bar Fig.(9):- phase composition diagram of CO2-ethanol system at 303K using MR2 10 8 6 6 4 EXP 308 k PR K12,l12 SRK k12,l12 2 SRK k12,l12 10 8 4 PR k12,l12 2 0 0 0 0.02 0.04 0.06 0.08 0.1 0.12 0.8 0.85 0.9 0.95 Fig.(10):- phase composition diagram of CO2-ethanol system at 303K using MR3 Diyala Journal of Engineering Sciences, Vol. 03, No. 01, June 2010 103 1 20 20 18 18 16 16 14 14 12 12 P bar P bar GAS-LIQUID EQUILIBRIUM PREDICTION OF CO2-ETHANOL SYSTEM AT MODERATE PRESSURES AND DIFFERENT TEMPERATURES 10 PR SRK Hysys SRK Hysys PR 10 8 8 6 6 4 EXP 323 k PR k12=0 SRK k12=0 Hysys SRK Hysys PR 4 2 2 0 0 0 0.05 0.1 0.15 0 0.2 0.5 1 Fig.(11):- phase composition diagram of CO2-ethanol system at 323K using MR1 20 20 18 PR SRK Hysys SRK Hysys PR 18 16 16 14 14 12 P bar P bar 12 10 10 8 8 6 6 EXP 323 k PR k12=0.1306247 SRK k12=0.1271771 Hysys SRK Hysys PR 4 2 4 2 0 0 0 0.02 0.04 0.06 0.08 0 0.1 0.5 1 Fig.(12):- phase composition diagram of CO2-ethanol system at 323K using MR2 20 20 18 18 16 16 14 14 12 12 PR k12,l12 P bar P bar SRK k12,l12 10 10 8 8 6 6 4 4 EXP 323 k PR K12,l12 2 0 0.001 2 SRK k12,l12 0 0.021 0.041 0.061 0.081 0 0.101 0.5 Fig.(13):- phase composition diagram of CO2-ethanol system at 323K using MR3 Diyala Journal of Engineering Sciences, Vol. 03, No. 01, June 2010 104 1 GAS-LIQUID EQUILIBRIUM PREDICTION OF CO2-ETHANOL SYSTEM AT MODERATE PRESSURES AND DIFFERENT TEMPERATURES تقدير اتزان غاز -سائل لنظام ثاني اوكسيد الكاربون -ايثانول عند ضغوط معتدلة ودرجات حرارة مختلفة أركان جاسم هادي مدرس مساعد كلية الهندسة ـ جامعة تكريت الخالصة تم إعداد نموذج التزان غاز-سائل لألنظمة الثنائية في الضغوط المعتدلة (الى حد 19بار) وعند درجات ح اررة مختلفة ( )323-288كلفن لثاني أوكسيد الكاربون مع االيثانول بإستعمال معادلة Soave/Redlich/Kwongومعادلة Peng-Robensonللحالة وقوانين خلط ) (mixing rulesمختلفة ومقارنة النتائج مع نتائج برنامج المحاكاة )(Hysys لنفس المعادلتين. قورنت نتائج النموذج مع نتائج تجريبية تم الحصول عليها من األدبيات المنشورة حديثا وقد تبين بان النموذج يعطي توافقا جيد جدا ألحد قوانين الخلط المستخدمة وجيد نوعا ما لألخرى ،كذلك تم مقارنة النتائج مع نتائج برنامج ( ) HYSYSوظهر تطابق تام في النتائج وكان هناك انحراف بسيط عندما يكون الضغط أكثر من 11بار تتراوح نسبته من 4*10-4إلى .2*10-4 الكلمات الدالة :توازن غاز-سائل ,قوانين خلط ,ثاني اوكسيد الكاربون ,ايثانول ,ضغوط عالية ,معادلة Soave/Redlich/Kwongومعادلة Peng-Robensonللحالة. Diyala Journal of Engineering Sciences, Vol. 03, No. 01, June 2010 105
