Hand Size
advertisement
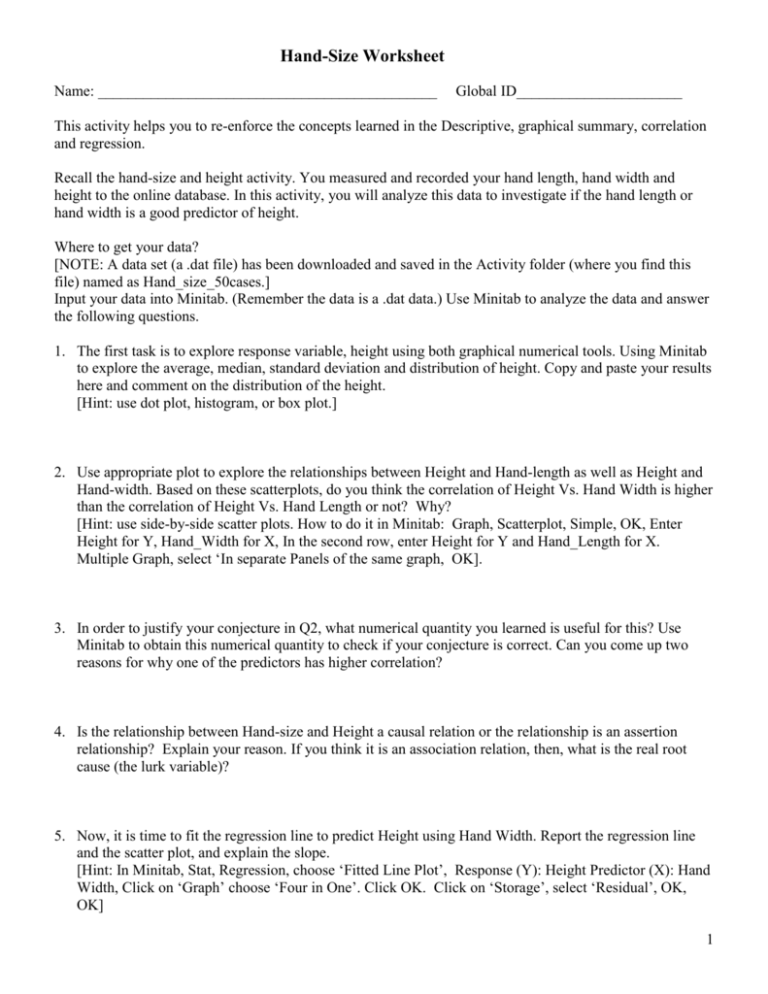
Hand-Size Worksheet Name: _____________________________________________ Global ID______________________ This activity helps you to re-enforce the concepts learned in the Descriptive, graphical summary, correlation and regression. Recall the hand-size and height activity. You measured and recorded your hand length, hand width and height to the online database. In this activity, you will analyze this data to investigate if the hand length or hand width is a good predictor of height. Where to get your data? [NOTE: A data set (a .dat file) has been downloaded and saved in the Activity folder (where you find this file) named as Hand_size_50cases.] Input your data into Minitab. (Remember the data is a .dat data.) Use Minitab to analyze the data and answer the following questions. 1. The first task is to explore response variable, height using both graphical numerical tools. Using Minitab to explore the average, median, standard deviation and distribution of height. Copy and paste your results here and comment on the distribution of the height. [Hint: use dot plot, histogram, or box plot.] 2. Use appropriate plot to explore the relationships between Height and Hand-length as well as Height and Hand-width. Based on these scatterplots, do you think the correlation of Height Vs. Hand Width is higher than the correlation of Height Vs. Hand Length or not? Why? [Hint: use side-by-side scatter plots. How to do it in Minitab: Graph, Scatterplot, Simple, OK, Enter Height for Y, Hand_Width for X, In the second row, enter Height for Y and Hand_Length for X. Multiple Graph, select ‘In separate Panels of the same graph, OK]. 3. In order to justify your conjecture in Q2, what numerical quantity you learned is useful for this? Use Minitab to obtain this numerical quantity to check if your conjecture is correct. Can you come up two reasons for why one of the predictors has higher correlation? 4. Is the relationship between Hand-size and Height a causal relation or the relationship is an assertion relationship? Explain your reason. If you think it is an association relation, then, what is the real root cause (the lurk variable)? 5. Now, it is time to fit the regression line to predict Height using Hand Width. Report the regression line and the scatter plot, and explain the slope. [Hint: In Minitab, Stat, Regression, choose ‘Fitted Line Plot’, Response (Y): Height Predictor (X): Hand Width, Click on ‘Graph’ choose ‘Four in One’. Click OK. Click on ‘Storage’, select ‘Residual’, OK, OK] 1 6. Using this regression line to predict your own height and obtain the residual of this predict. 7. Can you predict an individual’s height if his hand width is 20”? Why? 8. How much information can the Hand Width predict the height? In this class we discuss a measure to answer this question. What is it? Report this quantity from the output, and explain how this quantity related to the Pearson correlation. (i) Report the four-in-one residual plots. And make a diagnosis using the residual plots to decide if the model is adequate and report any problem you notice. 9. One particular problem is that there is case that looks likely an outlier. Closer check with the raw data, we notice a male student reported his Hand Width as 4’’ and Height 73”. This seems to be ‘unusual’. Explain why this is an ‘unusual case’, and decide if we should keep this case, or delete this case, and give your reason. 10. As we have discussed in class, that Hand Width is always longer than Hand Length, if it properly measured. Therefore, there must be some measuring error in this case. Delete this case and re-analyze the data. Report some of the outputs. Write a paragraph to make a comparison between these two models. Write a paragraph to and comment on the effect of this ‘unusual case. 2


