mc_s2-ch - WordPress.com
advertisement
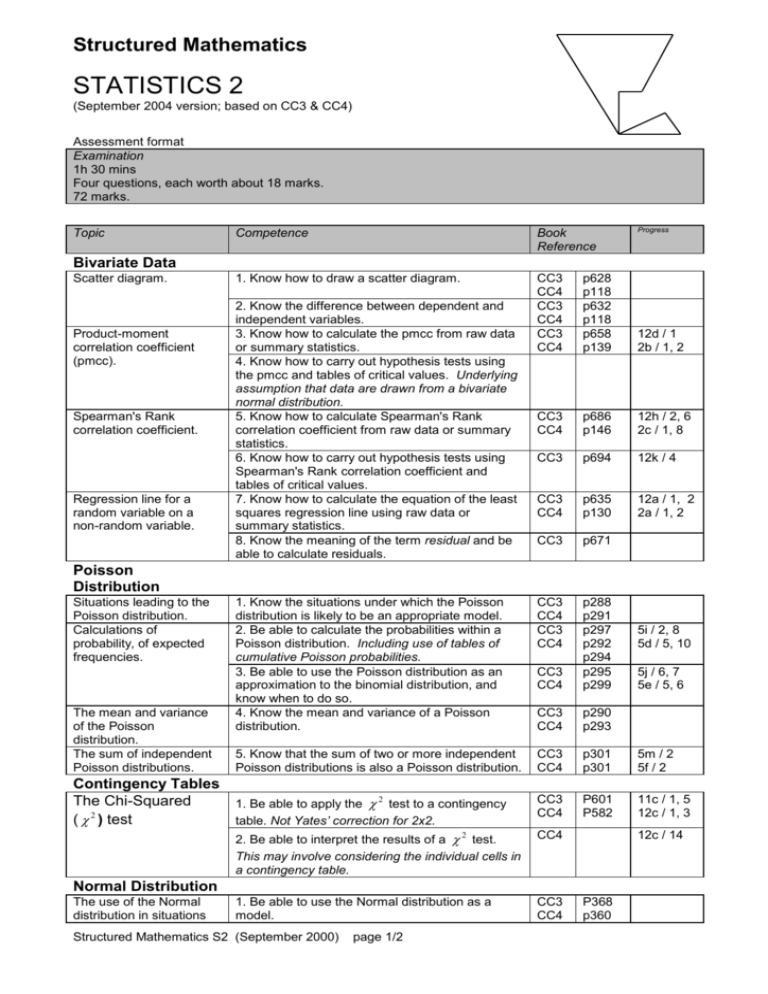
Structured Mathematics STATISTICS 2 (September 2004 version; based on CC3 & CC4) Assessment format Examination 1h 30 mins Four questions, each worth about 18 marks. 72 marks. Topic Progress Competence Book Reference 1. Know how to draw a scatter diagram. CC3 CC4 CC3 CC4 CC3 CC4 p628 p118 p632 p118 p658 p139 12d / 1 2b / 1, 2 CC3 CC4 p686 p146 12h / 2, 6 2c / 1, 8 CC3 p694 12k / 4 CC3 CC4 p635 p130 12a / 1, 2 2a / 1, 2 CC3 p671 1. Know the situations under which the Poisson distribution is likely to be an appropriate model. 2. Be able to calculate the probabilities within a Poisson distribution. Including use of tables of cumulative Poisson probabilities. 3. Be able to use the Poisson distribution as an approximation to the binomial distribution, and know when to do so. 4. Know the mean and variance of a Poisson distribution. CC3 CC4 CC3 CC4 CC3 CC4 p288 p291 p297 p292 p294 p295 p299 CC3 CC4 p290 p293 5. Know that the sum of two or more independent Poisson distributions is also a Poisson distribution. CC3 CC4 p301 p301 5m / 2 5f / 2 1. Be able to apply the 2 test to a contingency table. Not Yates’ correction for 2x2. CC3 CC4 P601 P582 11c / 1, 5 12c / 1, 3 2. Be able to interpret the results of a 2 test. This may involve considering the individual cells in a contingency table. CC4 1. Be able to use the Normal distribution as a model. CC3 CC4 Bivariate Data Scatter diagram. Product-moment correlation coefficient (pmcc). Spearman's Rank correlation coefficient. Regression line for a random variable on a non-random variable. 2. Know the difference between dependent and independent variables. 3. Know how to calculate the pmcc from raw data or summary statistics. 4. Know how to carry out hypothesis tests using the pmcc and tables of critical values. Underlying assumption that data are drawn from a bivariate normal distribution. 5. Know how to calculate Spearman's Rank correlation coefficient from raw data or summary statistics. 6. Know how to carry out hypothesis tests using Spearman's Rank correlation coefficient and tables of critical values. 7. Know how to calculate the equation of the least squares regression line using raw data or summary statistics. 8. Know the meaning of the term residual and be able to calculate residuals. Poisson Distribution Situations leading to the Poisson distribution. Calculations of probability, of expected frequencies. The mean and variance of the Poisson distribution. The sum of independent Poisson distributions. Contingency Tables The Chi-Squared ( 2 ) test Structured Mathematics S2 (September 2000) page 1/2 5j / 6, 7 5e / 5, 6 12c / 14 Normal Distribution The use of the Normal distribution in situations 5i / 2, 8 5d / 5, 10 P368 p360 where the distribution is given as Normal. The use of the Normal distribution as an approximation to the binomial and Poisson distributions. Hypothesis test for a single mean. 2. Be able to standardise a Normal variable and use the Normal Distribution Tables. 3. Be able to use the Normal distribution as an approximation to the binomial distribution and know when it is appropriate to do so. 4. Be able to use the Normal distribution as an approximation to the Poisson distribution and know when it is appropriate to do so. 5. Know when to use a continuity correction and be able to do so. 6. Be able to carry out a hypothesis test for a single mean using the Normal distribution and know when it is appropriate to do so. CC3 CC4 CC3 CC4 P378 p368 p396 p382 7d / 1 7b / 1, 3 7j / 6 7f / 2, 8 CC3 CC4 p404 p390 7k / 4 7g / 4 CC3 CC4 CC3 CC4 p399 p383 p511 p514 p519 10b / 1 11a / 1 Book references CC3 Crawshaw and Chambers, A Concise Course in A-level Statistics, 3rd edition. CC4 Crawshaw and Chambers, A Concise Course in A-level Statistics, 4th edition. [WG: 05/95; DJR 05/00; JA 06/04] Structured Mathematics S2 (September 2000) page 2/2


