AP Calculus Emphasis
advertisement
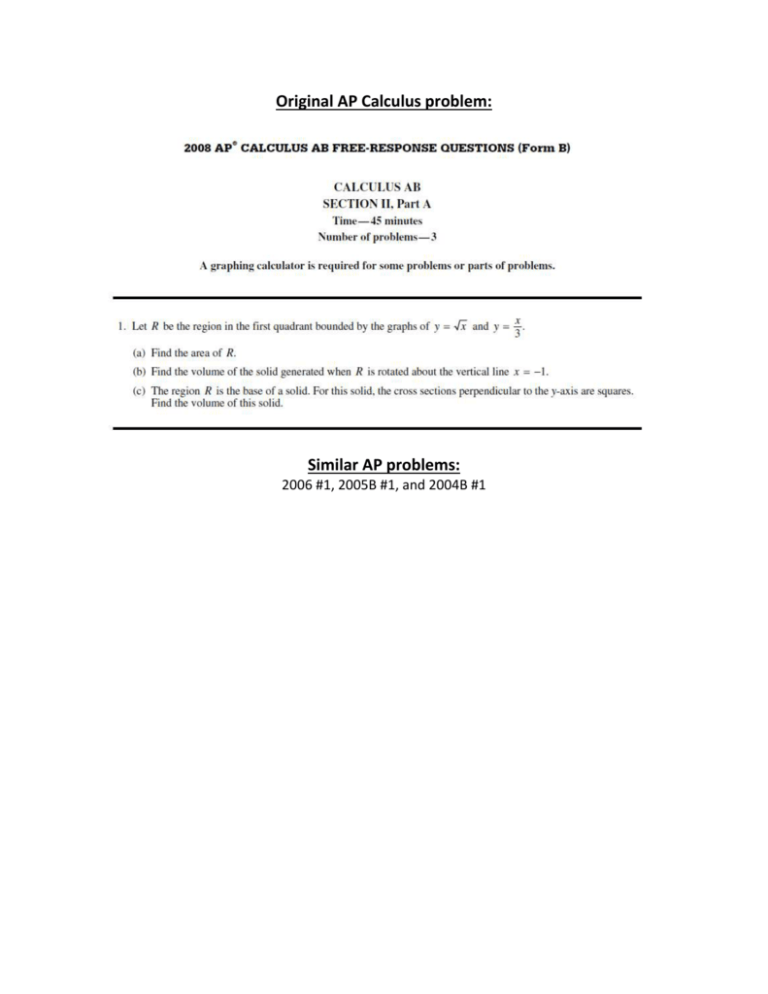
Original AP Calculus problem: Similar AP problems: 2006 #1, 2005B #1, and 2004B #1 Algebra II / Pre-Calculus Suggestion: Let f(x) = x and g(x) = x . 3 a) Sketch a line tangent to f(x) at x = 1 and x = 4. b) The tangent line to f(x) at the point x = 4 contains the point (20, 6). Find the equation of this line. 1 c) Let h(x) = 2 x be the slope of the line tangent to f(x) for any value of x. For what value of x is the slope of the tangent to f(x) parallel to the slope of g(x)? Show the computations that lead to your answer. Teacher notes: a) Tangent lines are a focal point in calculus so students should be introduced to what a tangent is and what it looks like on a graph. b) Tangent lines are a focal point in calculus so students should be introduced to what a tangent is and what it looks like on a graph and finding the equation. c) Students need to find the slope of g(x) using the traditional formula, then they need to set this value equal to the given slope formula of f(x) and solve for x. Original AP Calculus problem: Similar AP problems: 2008 #2, 2005 #3, and 2001 #2 Algebra II / Pre-Calculus Suggestion: Distance from the river’s edge (feet) Depth of the water (feet) 0 8 14 22 24 0 7 8 2 0 A scientist measures the depth of Doe River at Picnic Point. The river is 24 feet wide at this location. The measurements are taken in a straight line perpendicular to the edge of the river. The data are shown in the table above. The velocity of the water at Picnic Point, in feet per minute, is modeled ( t ) 1 62 s i n t 1 0for by v 0 ≤ t ≤ 120 minutes. x , as a model for the depth of 4 2 ) 8 s in a) A scientist proposes the function f , given by f(x the water, in feet, at Picnic Point x feet from the river’s edge. Is the scientist’s function a reasonable estimate for the depth of the river? Why or why not? b) A child wants to swim across the river. Using the velocity function, how far from the river edge will the child have hardest swim (fastest current)? Justify your answer. c) For what distances from the edge will the current be slowing down and for what distances from the edge will the current be speeding up? Teacher notes: a) Using a calculator students can compare table of values with the data to see that the scientist’s equation is a reasonable estimate of the river depth according to the data (but bring up that since the data set is not complete it is impossible to tell if the entire width of the river follows the function). b) Students should use their calculators to find the of the velocity function. Justification should be that this is the point where the function changes from increasing to decreasing. c) Students should use the calculator to find the intervals where the velocity is increasing and decreasing. Original AP Calculus problem: Similar AP problems: 2007B #4, 2006 #3, and 2004 #5 Algebra II / Pre-Calculus Suggestion: a) Write a piece-wise equation for the graph of f(x). Use slope intercept form for each line. b) For what interval(s) is the rate of change of f(x) positive? For what interval(s) is the rate of change of f(x) negative? Justify your answer. c) For what x value does f(x) reach a maximum value? Justify your answer. Teacher notes: a) Students should be comfortable with graphs and function notation of piece-wise functions. b) Students should be able to connect positive slope and positive rate of change with an increasing function and negative slope and negative rate of change with a decreasing function. c) Students need to justify their answer using the logic that the function is changing from increasing to decreasing. Original AP Calculus problem: Similar AP problems: 2007 #4, 2006B #2, and 2003 #2 – use interval 0 < x < 3 Algebra II / Pre-Calculus Suggestion: a) Use 5 rectangles with equal width to estimate the area between the curve and the x-axis (use your calculator to find the dimensions of the rectangles to four decimal places). Use 10 rectangles with equal width to estimate the area between the curve and the x-axis. What happens to your estimate as you increase the number of rectangles? b) Estimate the value of t for which the velocity of the particle is increasing the fastest. Explain the reasoning for your answer. c) Estimate how fast the velocity is increasing from part “a”. Explain the reasoning for your answer. d) Determine the value of t for which the particle is at rest. Justify your answer. e) Using your calculator, find the time for which the velocity is not changing. Justify your answer. Teacher notes: a) Students should be comfortable with graphs and function notation of piece-wise functions. b) Students should be able to connect positive slope and positive rate of change with an increasing function and negative slope and negative rate of change with a decreasing function. c) Students need to justify their answer using the logic that the function is changing from increasing to decreasing. Original AP Calculus problem: Similar AP problems: 2008 #4, 2002B #4, and 2000 #3 Algebra II / Pre-Calculus Suggestion: The graph of f(x) is shown above. a) Write an equation for a function with the same roots, multiplicities, and shape of f(x). b) Write the equation of the secant line connecting the points (0, -1) and (2, -1). For which x value(s) is the tangent line of f(x) parallel to the this secant line? Justify your answer. c) Find any local extrema and justify why these points are local extrema. d) Find any absolute extrema. e) For which x-value does the rate of increase appear to be the greatest? f) Estimate the intervals for which f(x) is concave up and concave down. g) Estimate the inflection point(s) on f(x). Teacher notes: a) The explanation is that the velocity is the increasing the fastest where the graph has the steepest positive slope. This point is actually the inflection point which is at x = 2.366. Student estimate should be close. b) This is the slope of the tangent line at x = 2.366 which is actually 1.1547. Student estimate should be close. Have students sketch a tangent line at their answer to part “a” to see and estimate the rate of change. c) When the particle is at rest it is not moving, meaning the velocity is zero. Zeros occur when t = 1 and t = 2. Original AP Calculus problem: Similar AP problems: 2005 #1, 2004 #2, and 2003 #1 Algebra II / Pre-Calculus Suggestion: a) Using your calculator, find the domain and range of region S and R. b) Find the slope of l and write the equation for l. c) Is l tangent to f(x) at the maximum value of f(x)? Use the slope of l to justify your answer. d) Find the length of the line segment connecting f(x) and l at x = 2 that is perpendicular to the xaxis. Teacher notes: a) Students should notice that the equation resembles a cubic with multiple zeros at x = 1. A possible answer might be f(x) = a(x – 1)2(x – 4). b) The slope of the secant line is zero. A connection should be made between tangent with slope of zero and max/min. The points that have a tangent parallel to the secant will be x = 1 and x = 3 b/c those are the max and min. c) Extrema is another word for maximum and minimum. Local extrema occur when the graph changes from increasing to decreasing and visa versa. d) Absolute extrema means the student needs to look at the local extrema and the endpoints and take the max and min from all local and the endpoints. e) Fastest rate of increase will occur where the graph is the steepest. Here it appears to be at x = 4 f) Concave down on [-1, 2) and (4, 5]. Concave up on (2, 4). g) Inflection points are where the graph changes concavity and these appear to be at x = 2 and x = 4 for this graph.
