Answers to Labs 4-5
advertisement

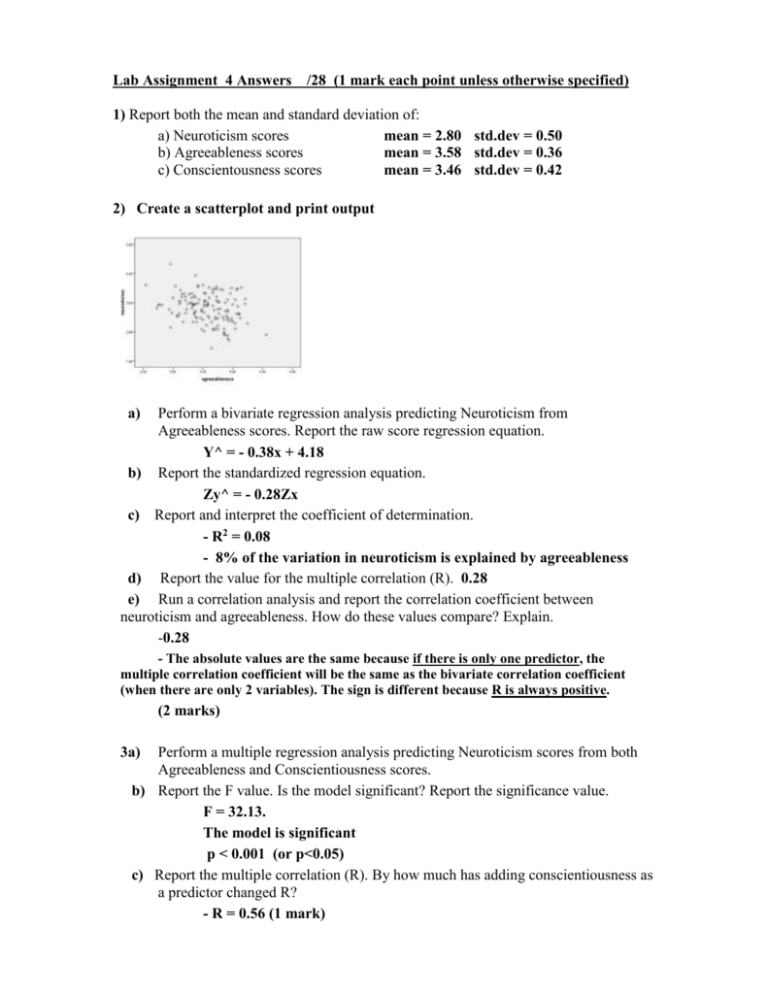
Lab Assignment 4 Answers /28 (1 mark each point unless otherwise specified) 1) Report both the mean and standard deviation of: a) Neuroticism scores mean = 2.80 std.dev = 0.50 b) Agreeableness scores mean = 3.58 std.dev = 0.36 c) Conscientousness scores mean = 3.46 std.dev = 0.42 2) Create a scatterplot and print output a) Perform a bivariate regression analysis predicting Neuroticism from Agreeableness scores. Report the raw score regression equation. Y^ = - 0.38x + 4.18 b) Report the standardized regression equation. Zy^ = - 0.28Zx c) Report and interpret the coefficient of determination. - R2 = 0.08 - 8% of the variation in neuroticism is explained by agreeableness d) Report the value for the multiple correlation (R). 0.28 e) Run a correlation analysis and report the correlation coefficient between neuroticism and agreeableness. How do these values compare? Explain. -0.28 - The absolute values are the same because if there is only one predictor, the multiple correlation coefficient will be the same as the bivariate correlation coefficient (when there are only 2 variables). The sign is different because R is always positive. (2 marks) 3a) Perform a multiple regression analysis predicting Neuroticism scores from both Agreeableness and Conscientiousness scores. b) Report the F value. Is the model significant? Report the significance value. F = 32.13. The model is significant p < 0.001 (or p<0.05) c) Report the multiple correlation (R). By how much has adding conscientiousness as a predictor changed R? - R = 0.56 (1 mark) - 0.564-0.279 = 0.29 increase in R (1 mark) (0.5 marks if included math and just calculated wrong) d) Report the standardized beta weights for Agreeableness and Conscientiousness. Report the significance values for each predictor. Agree: - 0.18 p = 0.01 Consc: - 0.50 p < 0.001 (or p<0.05) e) What does the standardized beta weight for agreeableness represent? For every 1 standard deviation increase in agreeableness, neuroticism score will change by - 0.18 standard deviations (or will decrease by 0.18 standard deviation units) f) Which is the better predictor, agreeableness or conscientiousness? Conscientiousness g) Amy has an Agreeableness score of 3.63, and a Conscientiousness score of 4.50. What do you predict her Neuroticism score will be using the unstandardized regression equation? (Include all work) y^ = - 0.25 (3.63) - .60(4.5) + 5.769 = - 0.9075 – 2.7 + 5.769 = 2.17 (2 marks: 1 mark if made error in calculation but included work) Lab 5: Answers: /46 (one mark each unless otherwise stated) One Sample 1. A psychologist is testing the hypothesis that completing a data analysis course may increase your IQ score. We know that the average WAIS IQ score before taking analysis was 110. After administering the WAIS IQ to all students successfully completing the data analysis course we obtained 35 scores. Open the Lab5a.sav file. H0:(in words) __Population Average Wais IQ score after course is equal to 110_____ H1:_____ Population Average Wais IQ score after course is > 110_ (or not equal to)_ **(want them to say “population” for all the hypotheses) Mean of WAIS IQ after course: ___118.20_____ std. deviation: ___8.14__________ Create a histogram of the WAIS scores. Print the output. (1 mark) Mean difference: ____8.20___________ Report the result of the analysis in APA format: __t(34) = 5.96, p <0.001 or p < 0.05 Decision regarding H0: (FAIL TO REJECT or REJECT) ______Reject__________ Independent Samples T-Test A professor has two introductory psychology classes. In one class he uses the standard lecture technique and in the other he uses a small-groups discussion technique. He wonders if it will make a difference on their exam score. He gives the same test to the two classes and obtains the following data (1=standard lecture, 2=small group discussion) Open Lab5b.sav. H0: ___Population average exam score is the same for both standard and small-group discussion groups_____ H1: ___Population average exam score is different between the standard and small-group discussion groups______ Standard Lecture exam score: Mean __78.00________ Small Groups exam score: Mean ____64.92_________ std. deviation _14.02___________ std. deviation __15.49___________ Create a bar graph comparing the exam scores of the standard and small group discussion groups. Print the output. (1 mark for graph) Conduct an Independent Samples T-Test. Mean Difference: ____13.08 ____________ Report the result of the analysis in APA format: __t(24)=2.23, p=0.03 or p<0.05_________________ Decision regarding H0: (FAIL TO REJECT or REJECT) _____Reject ____ What is your conclusion (based on what you put for Ho and H1 and the intro): Using the small-group discussion technique significantly decreases exam scores for an introductory psychology class compared to standard lecture technique. What is the range of values that you are 95% confident include the true difference between the groups?___ (1.12, 25.04)_________________________ Paired Samples A graduate student at UBC collected some survey data on the perceived competence of professors before and after lecture training. The graduate student asked ten subjects to rate the competence of their professors at UBC before and after the training session. Ratings were collected using the following 7-point Likert rating scale: Poor 1 2 Average 3 4 5 6 Outstanding 7 Open Lab5c. Generate your null and alternative hypotheses and write them below. H0:_The population average group ratings for competence of professors before and after lecture training are equal H1:_ The population average group ratings for competence of professors before and after lecture training are not equal Competence b4 training: Mean __3.80___ std. deviation __2.04__________ Competence after training: Mean ___5.00________ std. deviation __1.70_________ Create a scatterplot using the scores before and after the training session.. Print the output. (1 mark for graph) – doesn’t matter which variables on which axes Conduct a Paired Samples T-Test. Mean Difference: ______- 1.2_______(or 1.2)_____ Report the result of the analysis in APA format: ___t(9)= -1.39, p = 0.20__or p>0.05____________ correlation between before and after training scores: ____r = - 0.06______ Is the correlation significant? _____________yes_______________ Report the significance value: _____0.86___________________ Decision regarding H0: (FAIL TO REJECT or REJECT)_____FAIL TO REJECT___ What is your conclusion (based on what you put for Ho and H1): Lecture training does not significantly change student ratings of professor competence. What is the 95% confidence interval of the mean difference___(-3.16, 0.76)__or (-0.76, 3.16)_______? When do you use an independent vs a paired samples T-Test? An independent samples t-test is used when you have 2 groups of separate individuals and you want to compare the group means on some dependent variable. A paired-samples t-test is used when you have 2 conditions using the same or matched subjects and you want to compare the mean score between those 2 conditions. (2 marks – 1 for description of each type of test) TWO-WAY ANOVA Using the same data as in the Independent Samples T-Test (5b), pretend that a human resources person is assessing performance on a psychology 100 exam in classes taught by four different professors. Each professor teaches two sections of the class, one at 8:30am and one at 1:00pm. The human resources person wants to know if there is a difference in class performance between the different professors and between the different class times. Include a table of means and standard deviations for exam performance for each professor in each section. (1 mark) – supposed to be from the output (ran estimated marginal means – but another type of table is fine if they came up with it as long as the means are the same) Descriptive Statistics Dependent Variable:Psychology exam score classtime Professor Mean 8:00am Dr.Rogers 56.0000 9.89949 2 Dr. Claus 64.0000 15.44345 5 Dr. Clinton 63.6667 12.70171 3 Dr. Hogan 61.0000 12.24745 4 Total 61.9286 12.18110 14 Dr.Rogers 89.0000 8.20569 4 Dr. Claus 78.5000 13.43503 2 Dr. Clinton 83.0000 7.00000 3 Dr. Hogan 76.3333 20.84067 3 1:00 pm Std. Deviation N Total Total 82.5833 12.30269 12 Dr.Rogers 78.0000 18.71897 6 Dr. Claus 68.1429 15.46424 7 Dr. Clinton 73.3333 14.00952 6 Dr. Hogan 67.5714 16.93967 7 Total 71.4615 15.93796 26 Create a line graph representing exam performance for each professor and each class time. Different lines should represent different professors and x-axis should be class time. (1 mark) Report the following (full statistical details) *its fine if they include confidence intervals Main effect of Professor:____F(3,18) = 0.15, p >0.05 (or p = 0.93)__ Main effect of Class Time: __F(1,18) = 14.18, p<0.05____________ Professor X Class Time Interaction:___F(3,18) = 0.58, p >0.05 (or p = 0.64)__ __ Mean Square Error Term: ________176.32__________________ Interpret the results in complete sentences. (2 marks ) There was no significant difference in exam performance between the four different professors or a significant interaction with class time. All professors had similar average exam scores. However, the class time affected exam performance, such that students in sections of the class at 8:30am performed worse than students whose class time was at 1:00pm, suggesting that regardless of which professor they had, students performed better on the psychology exam if their class was in the afternoon than in the early morning. Collapsing across professors, what was the difference in exam scores between 8:30am and 1:00pm sections? _________20.54_________


