Lecture 8: More Continuous Random Variables
advertisement
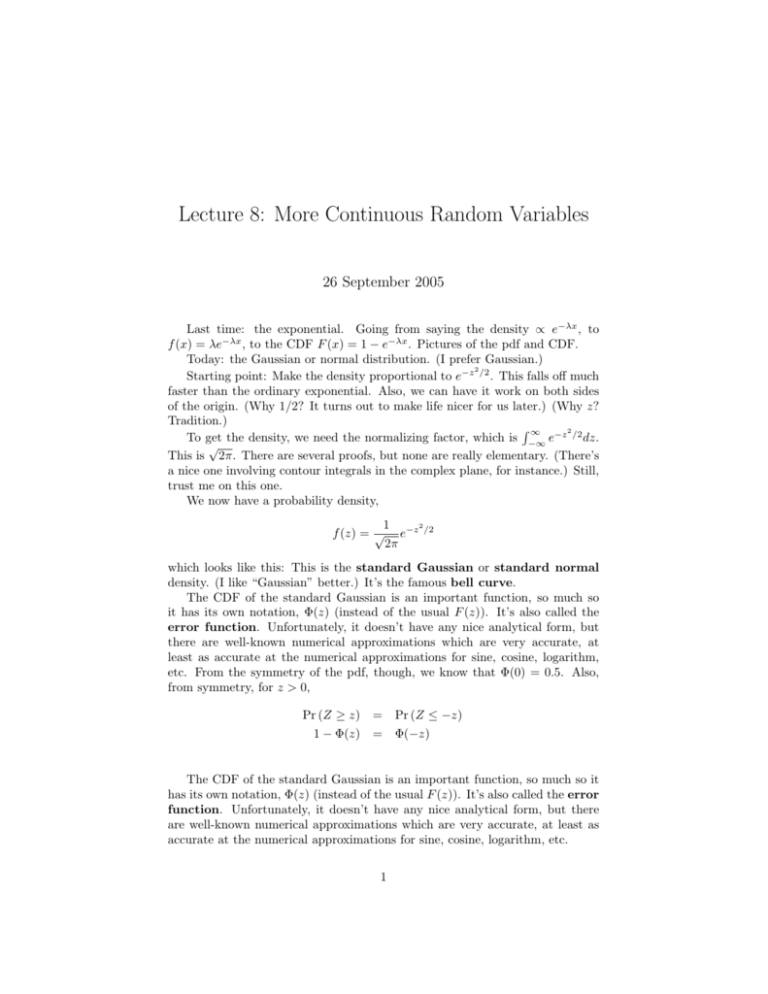
Lecture 8: More Continuous Random Variables 26 September 2005 Last time: the exponential. Going from saying the density ∝ e−λx , to f (x) = λe−λx , to the CDF F (x) = 1 − e−λx . Pictures of the pdf and CDF. Today: the Gaussian or normal distribution. (I prefer Gaussian.) 2 Starting point: Make the density proportional to e−z /2 . This falls off much faster than the ordinary exponential. Also, we can have it work on both sides of the origin. (Why 1/2? It turns out to make life nicer for us later.) (Why z? Tradition.) R∞ 2 To get the density, we need the normalizing factor, which is −∞ e−z /2 dz. √ This is 2π. There are several proofs, but none are really elementary. (There’s a nice one involving contour integrals in the complex plane, for instance.) Still, trust me on this one. We now have a probability density, 2 1 f (z) = √ e−z /2 2π which looks like this: This is the standard Gaussian or standard normal density. (I like “Gaussian” better.) It’s the famous bell curve. The CDF of the standard Gaussian is an important function, so much so it has its own notation, Φ(z) (instead of the usual F (z)). It’s also called the error function. Unfortunately, it doesn’t have any nice analytical form, but there are well-known numerical approximations which are very accurate, at least as accurate at the numerical approximations for sine, cosine, logarithm, etc. From the symmetry of the pdf, though, we know that Φ(0) = 0.5. Also, from symmetry, for z > 0, Pr (Z ≥ z) = Pr (Z ≤ −z) 1 − Φ(z) = Φ(−z) The CDF of the standard Gaussian is an important function, so much so it has its own notation, Φ(z) (instead of the usual F (z)). It’s also called the error function. Unfortunately, it doesn’t have any nice analytical form, but there are well-known numerical approximations which are very accurate, at least as accurate at the numerical approximations for sine, cosine, logarithm, etc. 1 0.4 0.3 0.2 standard Gaussian density 0.1 0.0 −4 −2 0 2 4 x Figure 1: Probability density of the standard Gaussian 2 0.8 0.6 0.4 0.2 0.0 Cummulative probability 1.0 Standard Gaussian distribution −4 −2 0 2 4 x Figure 2: CDF Φ of the standard Gaussian 3 2 At this point we can already find the mean, using the fact that e−z /2 is symmetric around the origin. Z ∞ 2 z √ e−z /2 dz E [Z] = 2π −∞ Z ∞ Z 0 2 2 z z √ e−z /2 dz + √ e−z dz = 2π 2π 0 −∞ Z ∞ Z ∞ 2 z −z2 /2 z √ e √ e−z /2 dz = dz − 2π 2π 0 0 = 0 2 As for the variance, Var (Z) = E Z 2 − (E [Z]) = E Z 2 . So let’s see that. Z E Z2 = ∞ 2 z2 √ e−z /2 dz 2π −∞ 2 This doesn’t cancel out, because z 2 = (−z) . In fact, one can show that this integral works out to be exactly 1. So the standard Gaussian has mean zero and variance 1. What about non-standard Gaussians? Well, consider the density of X = Z + µ. If a ≤ X ≤ b, then a − µ ≤ Z ≤ b − µ. z=b−µ Z Pr (a − µ ≤ Z ≤ b − µ) = z=a−µ x=b Z = x=a x=b 2 1 √ e−z /2 dz 2π 2 1 √ e−(x−µ) /2 dx 2π Z = fX (x)dx x=a fX (x) (x−µ)2 1 √ e− 2 2π = Now consider X = σZ, σ > 0. Pr (a ≤ X ≤ B) = Pr Z a b ≤Z≤ σ σ b z= σ = a z= σ Z x=b = x=a x=b 2 1 √ e−z /2 dz 2π 2 2 dx 1 √ e−z /2σ σ 2π Z = fX (x)dx x=a fX (x) = √ 4 1 2πσ 2 x2 e− 2σ2 Putting these together, X = σZ + µ has the density fX (x) = √ 1 2πσ 2 e− (x−µ)2 2σ 2 From the rules for expectation, E [X] = σE [Z] + µ = µ. From the rules for variance, Var (X) = σ 2 Var (Z) = σ 2 . We say that the equation above gives the distribution of a Gaussian with mean µ and variance σ 2 , N (µ, σ 2 ). An arbitrary Gaussian can be transformed into standard form by Z = (X − µ)/σ. By standardizing a Gaussian random variable, we keep ourselves from having to think about any distribution function other than Φ. Two numbers µ and σ completely determine the distribution, and completely specify the transformation back to standard form; they’re the parameters. The sum of two Gaussian variables is always another Gaussian, whether or not they are independent. A Gaussian times a constant is Gaussian. A Gaussian plus a constant is Gaussian. Here are some important facts: Pr (|Z| ≤ 1) = Φ(1) − Φ(−1) = 0.6826895 Pr (|Z| ≤ 2) = Φ(2) − Φ(−2) = 0.9544997 Pr (|Z| ≤ 3) = Φ(3) − Φ(−3) = 0.9973002 By applying the standardization above, we can see that a Gaussian falls within one standard deviation of its mean about two-thirds of the time, within two standard deviations about ninety-five percent of the time, and within three standard deviations about 99.7% percent of the time. Remember the Chebyshev inequality from before: Pr (|X − µ| ≥ kσ) ≤ Var (X) σ2 If X is Gaussian, then Pr (|X − µ| ≥ kσ) = 1 − (Φ(k) − Φ(−k)) Let’s compare the probability of large deviations from the mean given by Chebyshev to that obtained by the Gaussian. Clearly, the Gaussian distribution is much more tightly concentrated around its mean than arbitrary distributions. This will be very useful later. We will see starting next week that the sum of independent random variables tends towards a Gaussian; this is why it is so important and so ubiquitous. In particular, let’s look at a binomial distribution with contant p and growing n. I claim that X Bin(n, p) approaches in distribution N (np, np(1 − p)). Let’s look at some plots, keeping p = 0.5 for simplicity. There are a number of other distributions which are closely related to the Gaussian. 5 1.0 0.8 0.6 0.4 0.2 0.0 Prob(|X−mu| > k sigma) 0 1 2 3 4 6 8 1e−03 1e−07 1e−11 1e−15 Prob(|X−mu| > ksigma) k 0 2 4 k Figure 3: Comparison of the probability of large deviations for the Gaussian distribution (solid line) against the Chebyshev bounds, which apply to all distributions (dashed line). The lower figure shows the probability on a log scale. 6 p(x) 0.05 0.10 0.15 0.20 0.25 0.30 0.35 0 1 2 3 4 p(x) 0.00 0.05 0.10 0.15 0.20 0.25 x 0 2 4 6 8 10 0.00 0.05 p(x) 0.10 0.15 x 0 5 10 15 20 25 30 x Figure 4: Binomial distribution (solid line) versus a Gaussian density with the same mean and variance (dotted line), with p = 0.5 and n = 4, 10 and 30, respectively. 7 χ2 distribution: if Z is a standard Gaussian, then the distribution of Z 2 is said to be “χ2 with one degree of freedom”: x−1/2 e−x/2 √ 2π E [X] = 1 Var (X) = 2 fχ2 ,1 (x) = This comes up a lot in statistical testing, especially in the following Pn variant form. If Z1 , Z2 . . . Zn are all independent standard normals, then i=1 Zi2 has a χ2 distribution with n degrees of freedom: xn/2−1 e−x/2 Γ(n/2)2n/2 E [X] = n Var (X) = 2n fχ2 ,n = R∞ where Γ(x) = 0 tx−1 e− tdt, the gamma function. If x is an integer, √ then Γ(x) = (x − 1)!. For any x, Γ(x) = (x − 1)Γ(x − 1). Finally, Γ(1/2) = π. The χ2 distribution is a special case of a broader family of distributions called the γ distributions, which have the pdf fγ(α,θ) (x) = xα−1 e−x/θ Γ(α)θα They’re defined over non-negative x. If α > 1, then for small x this looks like xα−1 , and rises, but for large x it always looks like an exponential. In fact, the exponential is the space case where α = 1. For more, see the book. If Y = log X is Gaussian, we say that X is log-Gaussian or lognormal. Then X ≥ 0, and the distribution is specified by the mean and variance of Y , i.e. of log X, call them M and S 2 . In explicit form, flognormal (x) E [X] Var (X) e− (log x−M )2 2S 2 √ x 2πS 2 = = eM + S2 2 = e2M +S 2 2 eS − 1 The lognormal is the theoretical distribution that best fits the observed distribution of income and wealth. The mean and variance vary from country to country, but the general form doesn’t. One consequence of this is that rich people are really a lot richer than ordinary people, and that the mean isn’t so representative as the median. The median income is after all eM , but the mean is much higher! For instance, median household income in the United States is $42,228 (as of 2001), and the standard deviation of the log income is about 8 0.25 0.20 0.15 0.10 0.00 0.05 probability density 0 20 40 60 80 60 80 0.8 0.6 0.4 0.2 0.0 cummulative probability 1.0 x 0 20 40 x Figure 5: PDF and CDF of a gamma distribution with α = 3 and θ = 1. 9 0.879. This gives a mean income of about $62 thousand, which is very close to the true value of $58 thousand.1 1 The main problem with the log-normal model of income distribution is that there are slightly more really poor people than it allows for, and the rich people are much, much richer. 10 1.5e−05 1.0e−05 5.0e−06 0.0e+00 probability density 0e+00 2e+04 4e+04 6e+04 8e+04 1e+05 0.8 0.6 0.4 0.2 0.0 Cummulative probability 1.0 Income ($) 0 50000 150000 250000 Income ($) Figure 6: Density and CDF of a lognormal distribution with M = 42, 228 and S = 0.879, based on US income data. 11
