Statistical Analysis of Laboratory Data II
advertisement
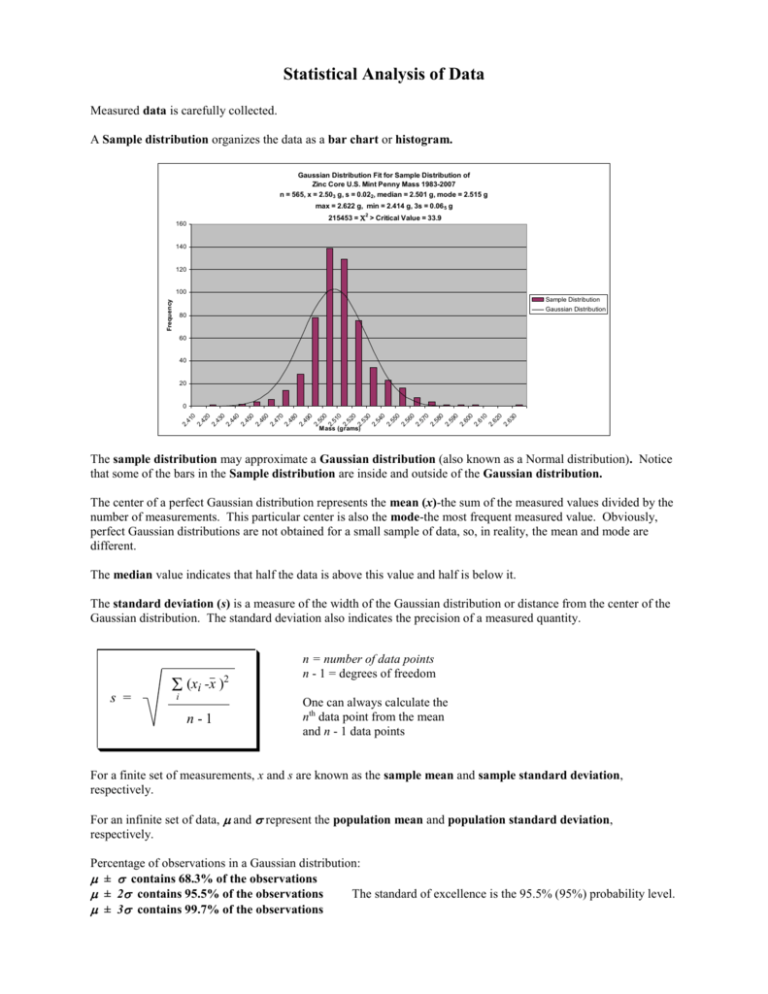
Statistical Analysis of Data Measured data is carefully collected. A Sample distribution organizes the data as a bar chart or histogram. Gaussian Distribution Fit for Sample Distribution of Zinc Core U.S. Mint Penny Mass 1983-2007 n = 565, x = 2.503 g, s = 0.022, median = 2.501 g, mode = 2.515 g max = 2.622 g, min = 2.414 g, 3s = 0.06 5 g 215453 = C2 > Critical Value = 33.9 160 140 120 Frequency 100 Sample Distribution Gaussian Distribution 80 60 40 20 62 0 61 0 60 0 59 0 58 0 57 0 56 0 55 0 54 0 63 0 2. 2. 2. 2. 2. 2. 2. 2. 2. 53 0 52 0 51 0 49 0 48 0 47 0 46 0 45 0 44 0 43 0 50 0 Mass (grams) 2. 2. 2. 2. 2. 2. 2. 2. 2. 2. 2. 42 0 2. 2. 2. 41 0 0 The sample distribution may approximate a Gaussian distribution (also known as a Normal distribution). Notice that some of the bars in the Sample distribution are inside and outside of the Gaussian distribution. The center of a perfect Gaussian distribution represents the mean (x)-the sum of the measured values divided by the number of measurements. This particular center is also the mode-the most frequent measured value. Obviously, perfect Gaussian distributions are not obtained for a small sample of data, so, in reality, the mean and mode are different. The median value indicates that half the data is above this value and half is below it. The standard deviation (s) is a measure of the width of the Gaussian distribution or distance from the center of the Gaussian distribution. The standard deviation also indicates the precision of a measured quantity. s = i (xi -x )2 n-1 n = number of data points n - 1 = degrees of freedom One can always calculate the nth data point from the mean and n - 1 data points For a finite set of measurements, x and s are known as the sample mean and sample standard deviation, respectively. For an infinite set of data, and represent the population mean and population standard deviation, respectively. Percentage of observations in a Gaussian distribution: ± contains 68.3% of the observations ± 2 contains 95.5% of the observations The standard of excellence is the 95.5% (95%) probability level. ± 3 contains 99.7% of the observations A confidence interval is a range of values in which there is a particular probability of finding the population mean. Better measurements (smaller s) give smaller confidence levels. Alternatively, more measurements (larger n) have the same effect. x ts + n Student's t (the t in the equation above): Find the value of t from the table below for the desired probability (%) and degrees of freedom (n-1). If a sample mean is 2.546 +/- 0.002 g for 3 measurements, then the population mean at the 95 % probability level is 2.546 +/- 0.005 g ( 4.303 0.002 / within the range 2.541 g –2.551 g. 3 ). This indicates that the population mean lies Table adapted from Harris, D. C. “Exploring Chemical Analysis” 4th edition, W. H. Freeman and Company, 2009 Rejection of Questionable Data: The Q-test For the given set of data calculate the Gap and the Range. 83.5 g/mol, 136.1 g/mol, 138.5 g/mol Range = 138.5-83.5 = 55.0 Gap = 136.1-83.5 = 52.6 (Gap = difference between the questionable data and the nearest value) Calculate Q calc: Q calc = gap/range = 0.956 and compare to Q95 (Q at the 95% confidence level) or Q90 (Q at the 90% confidence level): Table adapted from Harris, D. C. “Exploring Chemical Analysis” 4th edition, W. H. Freeman and Company, 2009: n Q95 Q90 3 observations: 4 observations: 5 observations: 6 observations: 7 observations: 8 observations: 9 observations: 10 observations: 0.970 0.829 0.710 0.625 0.568 0.526 0.493 0.466 0.941 0.765 0.642 0.560 0.507 0.468 0.437 0.412 If Qcalc > QX the questionable data can be rejected with X% confidence. For this example 83.5 g/mol cannot be rejected at the 95% level but can at the 90% level.
