Variance and standard deviation (grouped data)
advertisement
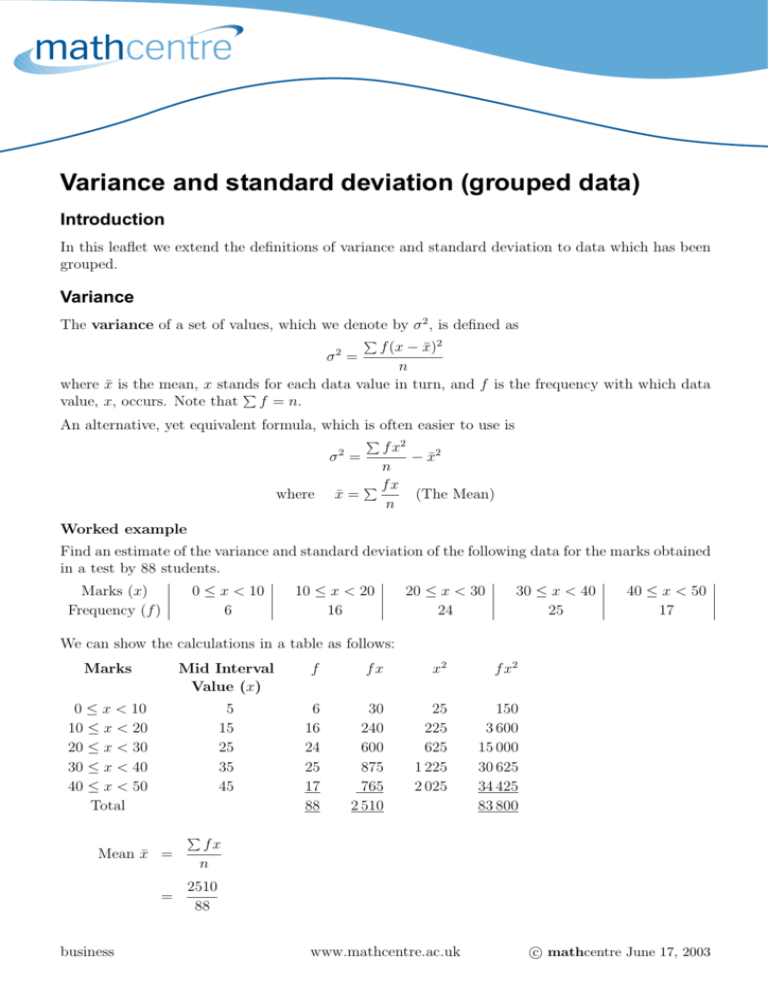
Variance and standard deviation (grouped data) Introduction In this leaflet we extend the definitions of variance and standard deviation to data which has been grouped. Variance The variance of a set of values, which we denote by σ 2 , is defined as f (x − x̄)2 n where x̄ is the mean, x stands for each data value in turn, and f is the frequency with which data value, x, occurs. Note that f = n. 2 σ = An alternative, yet equivalent formula, which is often easier to use is f x2 − x̄2 n fx x̄ = (The Mean) n 2 σ = where Worked example Find an estimate of the variance and standard deviation of the following data for the marks obtained in a test by 88 students. Marks (x) Frequency (f ) 0 ≤ x < 10 6 10 ≤ x < 20 16 20 ≤ x < 30 24 30 ≤ x < 40 25 40 ≤ x < 50 17 We can show the calculations in a table as follows: Marks Mid Interval Value (x) f fx x2 f x2 0 ≤ x < 10 10 ≤ x < 20 20 ≤ x < 30 30 ≤ x < 40 40 ≤ x < 50 Total 5 15 25 35 45 6 16 24 25 17 88 30 240 600 875 765 2 510 25 225 625 1 225 2 025 150 3 600 15 000 30 625 34 425 83 800 Mean x̄ = fx n = 2510 88 business www.mathcentre.ac.uk c mathcentre June 17, 2003 Variance σ 2 = f x2 − x̄2 n 2510 83800 = − 88 88 2 = 952.273 − 813.546 = 138.727 = 138.73 (2 dp) √ 138.727 Standard deviation = = 11.78 Exercises Find an estimate of the standard deviation of the following: 1. a) Lifetime (hours) of components 300 ≤ l < 400 400 ≤ l < 500 500 ≤ l < 600 600 ≤ l < 700 700 ≤ l < 800 Frequency b) Income (1000’s £) 13 25 66 58 38 10 ≤ i < 15 15 ≤ i < 20 20 ≤ i < 25 25 ≤ i < 30 30 ≤ i < 35 Frequency c) House Frequency prices (1000’s £) 9 40 ≤ p < 60 5 16 60 ≤ p < 80 9 22 80 ≤ p < 100 15 8 100 ≤ p < 120 8 5 120 ≤ p < 140 3 2. The grouped frequency table shows the length of service in years of employees who have been working for a company for at least ten years. Calculate an estimate of the standard deviation of the length of service of these employees. Length of Service (x) 10 ≤ x < 15 15 ≤ x < 20 20 ≤ x < 25 25 ≤ x < 30 30 ≤ x < 40 40 ≤ x < 50 Frequency (f ) 30 42 23 13 8 4 Answers 1. a) 112.37 hours b) £5 617 c) £21 994 2. 7.70 years (2 dp) Note that the units of standard deviation are the same as the original data units. This is not true of the variance where the units would be the square of the original data units. business www.mathcentre.ac.uk c mathcentre June 17, 2003

