P4 Global Warming 2, snapshot
advertisement
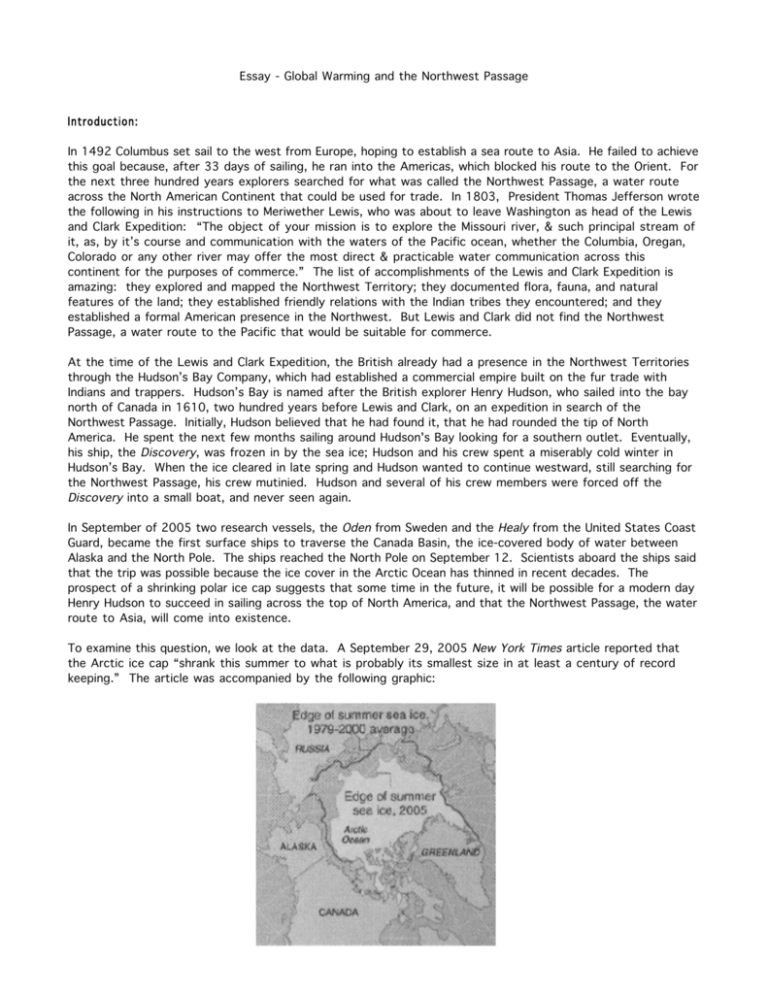
Essay - Global Warming and the Northwest Passage Introduction: In 1492 Columbus set sail to the west from Europe, hoping to establish a sea route to Asia. He failed to achieve this goal because, after 33 days of sailing, he ran into the Americas, which blocked his route to the Orient. For the next three hundred years explorers searched for what was called the Northwest Passage, a water route across the North American Continent that could be used for trade. In 1803, President Thomas Jefferson wrote the following in his instructions to Meriwether Lewis, who was about to leave Washington as head of the Lewis and Clark Expedition: “The object of your mission is to explore the Missouri river, & such principal stream of it, as, by it’s course and communication with the waters of the Pacific ocean, whether the Columbia, Oregan, Colorado or any other river may offer the most direct & practicable water communication across this continent for the purposes of commerce.” The list of accomplishments of the Lewis and Clark Expedition is amazing: they explored and mapped the Northwest Territory; they documented flora, fauna, and natural features of the land; they established friendly relations with the Indian tribes they encountered; and they established a formal American presence in the Northwest. But Lewis and Clark did not find the Northwest Passage, a water route to the Pacific that would be suitable for commerce. At the time of the Lewis and Clark Expedition, the British already had a presence in the Northwest Territories through the Hudson’s Bay Company, which had established a commercial empire built on the fur trade with Indians and trappers. Hudson’s Bay is named after the British explorer Henry Hudson, who sailed into the bay north of Canada in 1610, two hundred years before Lewis and Clark, on an expedition in search of the Northwest Passage. Initially, Hudson believed that he had found it, that he had rounded the tip of North America. He spent the next few months sailing around Hudson's Bay looking for a southern outlet. Eventually, his ship, the Discovery, was frozen in by the sea ice; Hudson and his crew spent a miserably cold winter in Hudson’s Bay. When the ice cleared in late spring and Hudson wanted to continue westward, still searching for the Northwest Passage, his crew mutinied. Hudson and several of his crew members were forced off the Discovery into a small boat, and never seen again. In September of 2005 two research vessels, the Oden from Sweden and the Healy from the United States Coast Guard, became the first surface ships to traverse the Canada Basin, the ice-covered body of water between Alaska and the North Pole. The ships reached the North Pole on September 12. Scientists aboard the ships said that the trip was possible because the ice cover in the Arctic Ocean has thinned in recent decades. The prospect of a shrinking polar ice cap suggests that some time in the future, it will be possible for a modern day Henry Hudson to succeed in sailing across the top of North America, and that the Northwest Passage, the water route to Asia, will come into existence. To examine this question, we look at the data. A September 29, 2005 New York Times article reported that the Arctic ice cap “shrank this summer to what is probably its smallest size in at least a century of record keeping.” The article was accompanied by the following graphic: The New York Times article describes a report from the National Snow and Ice Data Center (NSIDC) in Boulder, Colorado. Data from the NSIDC website give the extent of the September Arctic sea ice, in millions of square kilometers, from 1979 to 2005. Initial year extent 1979 7.2 1980 7.8 1981 7.3 1982 7.5 1983 7.5 1984 7.2 1985 6.9 1986 7.6 1987 7.5 1988 7.5 1989 7.0 1990 6.3 1991 6.6 1992 7.6 1993 6.5 1994 7.2 1995 6.2 1996 7.8 1997 6.8 1998 6.6 1999 6.2 2000 6.3 2001 6.8 2002 6.0 2003 6.2 2004 6.1 2005 5.5 Mathematical Data source: http://nsidc.org/news/press/20050928_trendscontinue.html Work: Before you write your essay, begin to analyze the data. Some initial mathematical work will get you started. • Let t represent the number of years since 1980 and f(t) represent the extent of the September Arctic sea ice, in millions of square kilometers. Enter the data into a spreadsheet and use the spreadsheet to construct a scatterplot of the data. Begin to think about what the data tell you. • Although there is year to year variation, the scatterplot shows an overall downward trend. It is reasonable to model this trend with a linear function. Select two points from the scatterplot to determine a line that will be a good trend line for the data. Use these two points to find a linear model that describes the extent of the Arctic sea ice as a function of t, the number of years since 1980. • Use the spreadsheet to graph the linear model on the scatterplot. Recall that the data will appear on the graph, as discrete points, and then the model will be superimposed as a line. This gives a good visual check of the fit of your model. Does your model produce an accurate trend line for the data? If not, start over; select two other data points which will produce a better model for you. • To answer the following questions, you will need to extend your graph out into the future. Spend some time making your graph look nice by providing a title for the graph, labeling the axes, constructing a helpful legend, and choosing pleasing shapes and colors. Remember that both the table and the graph from the spreadsheet will be copied into your paper. • Use the graph to approximate the answers to the following: • predict the extent of the September Arctic sea ice in the year 2050. • predict the year in which the extent of the September Arctic sea ice will reach zero -- that is, the year in which there will be no ice in the Arctic region in the summer. • Use the linear model (the equation) to approximate the answers to the following: • predict the extent of the September Arctic sea ice in the year 2050. • predict the year in which the extent of the September Arctic sea ice will reach zero -- that is, the year in which there will be no ice in the Arctic region in the summer. Be sure to incorporate the answers to the above questions in your discussion of the linear model in your paper. The mathematical details involved in deriving your model and in answering the final questions should be presented in an appendix to your paper. Writing Your Paper: The introduction: You may want to begin by setting the data in a historical context. Or perhaps you would prefer to start with a general discussion of global warming. Or you may have another idea for introducing the topic. Whatever strategy you choose, write an introduction that will appeal to the reader. First body paragraph : Here you should examine your data on extent of September Arctic sea ice and present the mathematical model you have developed. Explain where the data came from, how you developed your model, and (very importantly) what it (the model) definitely tells you. A table of the data and a graph showing the data and model, all carefully labeled, should be included. You should also discuss, qualifying your statements carefully, what the model seems to indicate (but does not prove). Further body paragraphs : Devote one paragraph to a discussion of the predictions of your mathematical model on the extent of the Arctic sea ice, and discuss what this would mean for the Northwest Passage. In another paragraph discuss whether or not the data and your model are consistent with the hypothesis that global warming is occurring. You will also want to think about the possible limitations of your model. Do you expect it to be an accurate forecast of the future? Or do you think the model might break down in some fashion? If you expect that your model might break down, discuss the factors that you think will cause the model to break down and the ways in which this will affect your predictions. This data, and your model, by themselves, are not enough to prove that global warming is occurring. Discuss what additional information or data you would need in order to to be able to conclude, with certainty, that either global warming is occurring or that global warming is not occurring. Conclusion: Here you should summarize what you have learned from your examination of data and logic in this paper. Perhaps you can come back to your introductory strategy in some way, to give a particularly satisfying conclusion. Due Dates: Completed rough draft due Wednesday, February 22 Paper due on Monday, February 27 Sources: Zinn, Howard. A People’s History of the United States. New York, NY: HarperCollins Publishers Inc. 1999 Ambrose, Stephen E. Undaunted Courage. New York, NY: Simon & Schuster Inc. 1997 Millman, Lawrence. “Looking for Henry Hudson” in Smithsonian, Oct. 1999 http://scrippsnews.ucsd.edu/article_detail.cfm?article_num=699
