Compensation of Earth Faults In Ungrounded Systems
advertisement
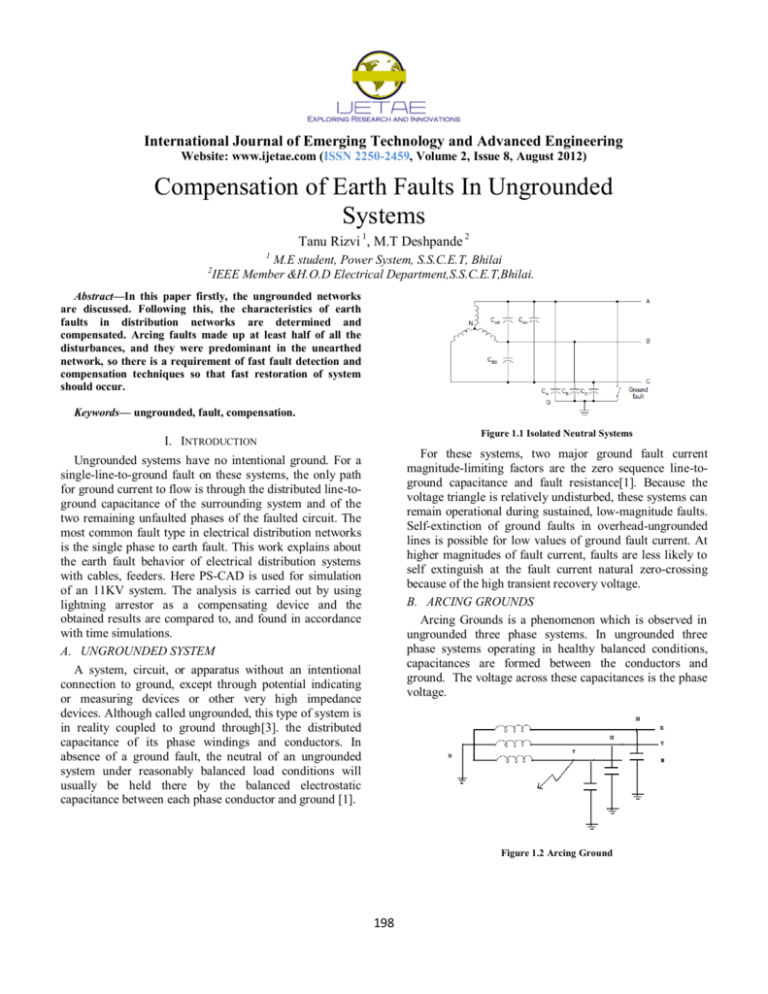
International Journal of Emerging Technology and Advanced Engineering Website: www.ijetae.com (ISSN 2250-2459, Volume 2, Issue 8, August 2012) Compensation of Earth Faults In Ungrounded Systems Tanu Rizvi 1, M.T Deshpande 2 1 2 M.E student, Power System, S.S.C.E.T, Bhilai IEEE Member &H.O.D Electrical Department,S.S.C.E.T,Bhilai. Abstract—In this paper firstly, the ungrounded networks are discussed. Following this, the characteristics of earth faults in distribution networks are determined and compensated. Arcing faults made up at least half of all the disturbances, and they were predominant in the unearthed network, so there is a requirement of fast fault detection and compensation techniques so that fast restoration of system should occur. Keywords— ungrounded, fault, compensation. Figure 1.1 Isolated Neutral Systems I. INTRODUCTION For these systems, two major ground fault current magnitude-limiting factors are the zero sequence line-toground capacitance and fault resistance[1]. Because the voltage triangle is relatively undisturbed, these systems can remain operational during sustained, low-magnitude faults. Self-extinction of ground faults in overhead-ungrounded lines is possible for low values of ground fault current. At higher magnitudes of fault current, faults are less likely to self extinguish at the fault current natural zero-crossing because of the high transient recovery voltage. B. ARCING GROUNDS Arcing Grounds is a phenomenon which is observed in ungrounded three phase systems. In ungrounded three phase systems operating in healthy balanced conditions, capacitances are formed between the conductors and ground. The voltage across these capacitances is the phase voltage. Ungrounded systems have no intentional ground. For a single-line-to-ground fault on these systems, the only path for ground current to flow is through the distributed line-toground capacitance of the surrounding system and of the two remaining unfaulted phases of the faulted circuit. The most common fault type in electrical distribution networks is the single phase to earth fault. This work explains about the earth fault behavior of electrical distribution systems with cables, feeders. Here PS-CAD is used for simulation of an 11KV system. The analysis is carried out by using lightning arrestor as a compensating device and the obtained results are compared to, and found in accordance with time simulations. A. UNGROUNDED SYSTEM A system, circuit, or apparatus without an intentional connection to ground, except through potential indicating or measuring devices or other very high impedance devices. Although called ungrounded, this type of system is in reality coupled to ground through[3]. the distributed capacitance of its phase windings and conductors. In absence of a ground fault, the neutral of an ungrounded system under reasonably balanced load conditions will usually be held there by the balanced electrostatic capacitance between each phase conductor and ground [1]. Figure 1.2 Arcing Ground 198 International Journal of Emerging Technology and Advanced Engineering Website: www.ijetae.com (ISSN 2250-2459, Volume 2, Issue 8, August 2012) Now, in the event of a ground fault, the voltage across the faulty conductor becomes zero while the voltages across the healthy conductors increase by a factor of 1.732. The arc caused between the faulty conductor and the ground gets extinguished and restarts many times, this repeated initiation and extinction of the arc across the fault produces severe voltage oscillations of the order of nearly three to four times the nominal voltage. This repeated arcing across the fault due to the capacitances between the conductors and the ground is known as arcing grounds. Arcing grounds can be compensated by the use of Peterson Coils or by using any of grounding methods. No ground fault It also requires man power for fault identification and location, as well as for its restoration. Clearance time increases as well as the thermal stress on insulation of motor winding, associated with switchgear equipments like transformers, cables etc increases. This methodology hampers system reliability and Clearance time increases as well as the thermal stress on insulation of motor winding, associated with switchgear equipments like transformers, cables etc increases. This increases maintenance cost. Also if the existing fault has not been resolved, it will result in a second ground fault in a different phase which will lead to short circuit in the system and it will also result in multiple failures in the system. In order to mitigate above challenges and have better system reliability, it is proposed to adopt an automatic system to detect and locate the fault current so as to attain faster system equilibrium. Various grounding methods can be employed for neutralization of fault currents, which helps in reducing fault currents by applying various degree of compensation. Generally Peterson coil is used in industries and plants as a compensating device. Ground fault on 1 phase Figure 1.3 Voltages during ground fault[6] II. PRESENT TECHNIQUE FOR DETECTION OF FAULTY FEEDER The present technique that is employed to detect the faulty feeder is the conventional voltmeter method. In order to detect fault in both the sections, By isolating the sections, the voltmeter of healthy sections shows the phase values. Now from this field engineers can identify the section in which fault has occurred, but still the faulty feeder has to be identified. For this, field engineers then isolate each feeder one by one until the faulty feeder is identified. As soon as the faulty feeder has been identified and isolated, the voltmeters of corresponding section again shows the phase values as before. This process is time consuming and calls for regular monitoring. 199 International Journal of Emerging Technology and Advanced Engineering Website: www.ijetae.com (ISSN 2250-2459, Volume 2, Issue 8, August 2012) III. LAYOUT OF 11KV SECTION Figure 1.4 Layout of 11KV section The layout contains 132KV source stepped down to 11 KV with the help of an 80MVA transformer. The primary winding of these transformers are connected in star and secondary in delta i.e ungrounded from each 11 KV section has two sub sections which are connected through sectionalized breaker and feed six feeders each giving supply to various loads. PSCAD/EMTDC uses subsystems, which breaks the whole job into smaller units and makes the understanding easy. In EMTDCthere the user can write his own program, which best suits, his in within a single integrated environment. Due to thepresence of the simulation and integrate it to the main program.The PSCAD graphical user interface greatly enhances the power and usability of the simulation environment. It allows the user to efficiently construct a circuit schematic, run a simulation, analyze the results, and 1) Plot For Source Voltage (Rms Voltage 132.0KV, Line to ground instantaneous Voltage 107.7KV. ) IV. SIMULATION IN PS-CAD & RESULTS PSCAD was first conceptualized in 1988 and began its long evolution as a tool to generate data files for the EMTDC simulation program. PSCAD/EMTDC is a powerful electromagnetic transient’s simulation program. It is most suitable for time domain simulations of the systems. It is an industry standard simulation tool. The graphical interface of the software makes it very easy to build the circuit and observe the results manage the data in a completely integrated graphical environment. PSCAD provides intuitive and interactive control input, meters, and online plotting functions and graphs. PSCAD has been adopted worldwide by utilities, manufacturers, research & educational institutions, and consultants as the premier tool for transient simulation. Graphical interface the time for the development of the program is drastically reduced. Source Voltage 125 Vr Vy Vb 100 75 Vo lt a g e KV 50 25 0 -25 -50 -75 -100 -125 Time S 200 0.150 0.170 0.190 0.210 0.230 0.250 0.270 0.290 0.310 0.330 0.350 ... ... ... International Journal of Emerging Technology and Advanced Engineering Website: www.ijetae.com (ISSN 2250-2459, Volume 2, Issue 8, August 2012) 2) Plot for 11KV section during normal condition Phase to ground rms Voltage 6.35KV and instantaneous voltage 8.98 KV. c) Plot for persisting Voltage for certain durations Voltage graph for single phase a to ground fault, fault duration 0.1s, persisting for certain time durations. Instantaneous Voltage at Load Bus1 Instantaneous Voltage at Load Bus1 Ea 12.0 Eb Ec Ea 30 10.5 9.0 Eb Ec 20 7.5 6.0 10 Vo lt a g e KV Vo lt a g e KV 4.5 3.0 1.5 0.0 -1.5 -3.0 0 -10 -4.5 -6.0 -20 -7.5 -9.0 -10.5 -30 -12.0 Time S Time S 0.350 0.360 0.370 0.380 0.390 0.400 0.410 0.420 0.430 0.440 0.100 ... ... ... 0.450 0.150 0.200 0.250 0.300 0.350 0.400 0.450 0.500 0.550 0.600 0.650 0.700 ... ... ... d) Plot for Arcing Current persisting for long time Plot shows the Arcing current graph for single phase a to ground fault, in which arc starts at .2s,restrikes after .125s and again restrikes after .1s. 3) Faulty Conditions a) Plot for Voltage The voltage of faulted phase is zero and the healthy phase’s increases to 1.732 times which is 15.5KV. Arcing Fault Current Ifa Instantaneous Voltage at Load Bus1 Ea 20.0 Eb Ec 0.050 0.040 15.0 Arcin g cu rre n t (kA) 0.030 10.0 Vo lt a g e KV 5.0 0.0 0.020 0.010 0.000 -0.010 -0.020 -5.0 -0.030 -10.0 -0.040 -0.050 -15.0 Time S 0.100 0.150 0.200 0.250 0.300 0.350 0.400 0.450 0.500 0.550 0.600 0.650 0.700 -20.0 Time S 0.00 0.10 0.20 0.30 0.40 ... ... ... 0.50 4) Suppression of high voltage by using Lighting arrestor a) Plot for Voltage The voltage of faulted phase is zero and the healthy phases increases to 1.732 times which is 15.5KV. This is voltage graph at 0 % compensation using LA. b) Plot for Arcing Current Arcing current graph for 11 KV line ungrounded system for single phase a to ground fault, fault duration is 0.2s.The maximum value reaches to 20A. Instantaneous Voltage at Load Bus1 Arcing Fault Current 0.0250 Ifa 0.0200 0.0100 Vo lt a g e KV Arcin g cu rre n t (kA) 0.0150 0.0050 0.0000 -0.0050 -0.0100 -0.0150 Time S 0.00 0.10 0.20 ... ... ... 0.30 0.40 0.50 Time S ... ... ... 201 20.0 18.0 16.0 14.0 12.0 10.0 8.0 6.0 4.0 2.0 0.0 -2.0 -4.0 -6.0 -8.0 -10.0 -12.0 -14.0 -16.0 -18.0 -20.0 0.00 Ea Eb 0.10 Ec 0.20 0.30 0.40 0.50 ... ... ... International Journal of Emerging Technology and Advanced Engineering Website: www.ijetae.com (ISSN 2250-2459, Volume 2, Issue 8, August 2012) b) Plot for Arcing Current Arcing current graph at 0 % compensation using LA. That is there is no effect in arcing current. e) Plot for Voltage The voltage of faulted phase is zero and the healthy phases has been compensated to 11KV using LA for with 70 % compensation. Fault Current Ifa 0.0250 Instantaneous Voltage at Load Bus1 0.0150 Vo lt a g e KV cu rre n t (kA) 0.0100 0.0050 0.0000 -0.0050 -0.0100 -0.0150 Time S 0.00 0.10 0.20 0.30 0.40 0.50 Time S ... ... ... Ec 0.50 ... ... ... 0.050 0.000 -0.050 -0.100 -0.150 -0.200 Time S 0.10 0.20 0.30 0.40 0.50 ... ... ... 0.00 0.10 Fault Current 0.040 0.030 Vo lt a g e KV 0.020 0.010 0.000 -0.010 -0.020 -0.030 -0.040 -0.050 0.20 0.30 0.40 0.50 ... ... ... Instantaneous Voltage at Load Bus1 0.050 0.10 0.20 g) Plot for Voltage The voltage of faulted phase is zero and the healthy phases has been compensated to 10KV using LA for with 85 % compensation. Ifa cu rre n t (kA) 0.40 0.100 0.00 0.00 0.30 0.150 d) Plot for Arcing Current Arcing current graph at 30 % compensation using LA. Time S 0.20 Fault Current cu rre n t (kA) Vo lt a g e KV Time S Eb 0.10 Ec Ifa 0.200 Instantaneous Voltage at Load Bus1 Ea 0.00 Eb f) Plot for Arcing Current Arcing current graph at 70 % compensation using LA. c) Plot for Voltage The voltage has been compensated to 14KV using LA for with 30 % compensation. 20.0 18.0 16.0 14.0 12.0 10.0 8.0 6.0 4.0 2.0 0.0 -2.0 -4.0 -6.0 -8.0 -10.0 -12.0 -14.0 -16.0 -18.0 -20.0 Ea 20.0 18.0 16.0 14.0 12.0 10.0 8.0 6.0 4.0 2.0 0.0 -2.0 -4.0 -6.0 -8.0 -10.0 -12.0 -14.0 -16.0 -18.0 -20.0 0.0200 0.30 0.40 0.50 ... ... ... Time S 202 20.0 18.0 16.0 14.0 12.0 10.0 8.0 6.0 4.0 2.0 0.0 -2.0 -4.0 -6.0 -8.0 -10.0 -12.0 -14.0 -16.0 -18.0 -20.0 0.00 Ea Eb 0.10 Ec 0.20 0.30 0.40 0.50 ... ... ... International Journal of Emerging Technology and Advanced Engineering Website: www.ijetae.com (ISSN 2250-2459, Volume 2, Issue 8, August 2012) h) Plot for Arcing Current Arcing current graph at 85% compensation using LA. TABLE II RESULTS FOR VARIOUS LEVEL OF GROUNDING Fault Current 0.200 Ifa 0.150 0.100 cu rre n t (kA) 0.050 0.000 -0.050 -0.100 -0.150 -0.200 Time S 0.00 0.10 0.20 0.30 0.40 0.50 ... ... ... VI. FUTURE SCOPE Changes in voltage and current can be studied for different fault conditions in order to determine the area of fault, where exact location of fault can be located. Researchers had been suggested that this systems can be programmed using advanced microprocessors or microcontrollers for better control and fast recovery operations within fractions of time, also various software such as MATLAB, MI-POWER, can be involved or various techniques such as wavelet transform, artificial neural networks techniques can also be employed in addition with this software. Since the developed model was not provided with a decision scheme, work may be extended to include a comprehensive relay model including trip scheme. Work may be extended to incorporate algorithms used to improve the relay behavior, when the model is to be used to protect power systems incorporate power cables having a considerable capacitance. V. CONCLUSION The most common fault type in electrical distribution networks is the single phase to earth fault. Earth faults are normally located by splitting the feeder into sections. To find out the faulty section the field engineers need to isolate the sections, by isolating the sections with circuit breakers, the voltmeter of healthy sections shows the phase values. Now from this field engineers can identify the section in which fault has occurred, but still the faulty feeder has to be identified. For this, field engineers then isolate each feeder one by one until the faulty feeder is identified. The operation of manually controlled switches requires a patrol moving in the terrain. Therefore, to decrease the customer’s outage time, the development of indication and location methods for earth faults is essential. The aim is to compensate it using LA. Based on these characteristics new methods for fault indication and location are developed.LA compensates the increased voltage of healthy phases according to various degree of compensation provided and thus it prevents failures of other equipments which may further cause multiple failures and can collapse the system. REFERENCES [1 ] Normann Fischer and Daqing Hou “Methods for detecting ground faults in medium voltage distribution power systems”, 2006. [2 ] Nay Kyi Htwe “Analysis and Design Selection of Lightning Arrester for Distribution Substation” World Academy of Science, Engineering and Technology, 2008. 203 International Journal of Emerging Technology and Advanced Engineering Website: www.ijetae.com (ISSN 2250-2459, Volume 2, Issue 8, August 2012) [3 ] Jeff Roberts, Dr. Hector J. Altuve, and Dr. Daqing Hou “Review of ground fault protection methods for grounded, ungrounded, and compensated distribution systems” . [4 ] M. Mirzaei, M.Z. A Ab Kadir, E. Moazami and H. Hizam “Review of Fault Location Methods for Distribution Power System”, Australian Journal of Basic and Applied Sciences, 3(3): pp-26702676, 2009, ISSN 1991-8178, © 2009, INSInet Publication. [5 ] Alberto Borghetti, Mauro Bosetti, Mauro Di Silvestro,Carlo Albert Nucci, Mario Paulone, Lorenzo Peretto, Elisa Scalla and Roberto Tinarelli “Assessment of fault location in power distribution networks” Electrical power quality and utilization, Journal Vol 13,No. 1 ,2007. [6 ] Daqing Hou and Normann Fischer” Deterministic High-Impedance Fault Detection and Phase Selection on Ungrounded Distribution System“,2005. [7 ] Andrzej Sowa,Jaroslaw Wiater”Evaluation Of Arrestors Protection Level During Lightning Strikes To Overhead MediumVoltage Lines”,Simposio internacional sobre calidad de la energia electrica,octubre 30,31 Noviembre 1 de, 2003. [8 ] S. Hanninen, M. Lehtonen and T.Hakola “Earth Faults and Related Disturbances in Distribution Networks”. IEEE PES SM2001, Vancouver, Canada, July 15–19, 2001. [9 ] Seppo Hanninen, Matti Lehtonen and Urho Pulkkinen” A probabilistic method for detection and location of very high resistive earth faults”. EPSR (Electric Power Systems Research,Vol. 54, No. 3, pp. 199-206,1999. [10 ] S. Hänninen and M. Lehtonen “Method for Detection and Location of Very High Resistive Earth Faults”. ETEP (European Transaction on Electrical Power),Vol. 9, No. 5, pp. 285-291,1999. [11 ] Seppo Hanninen and Matti Lehtonen ”Characteristics of earth faults in electrical distribution networks with high impedance earthing”. EPSR (Electric Power Systems Research) Vol. 44, No. 3, pp. 155161,1998. [12 ] Mark Adamiak, Craig Wester, Manish Thakur and Charles Jensen in ”High Impedance Fault Detection On Distribution Feeders “. Tanu Rizvi presently pursuing her M.E in power system engineering from Shri Shankaracharya College of Engineering & Technology. M.T Deshpande presently working as Head of Department (Electrical)in Shri Shankaracharya College of Engineering & Technology, IEEE member.He is M.Tech inPower System ,having 31 years of experience in steel industry and 9 years in teaching, 204

