Experiment 1 Mapping Electric Fields
advertisement
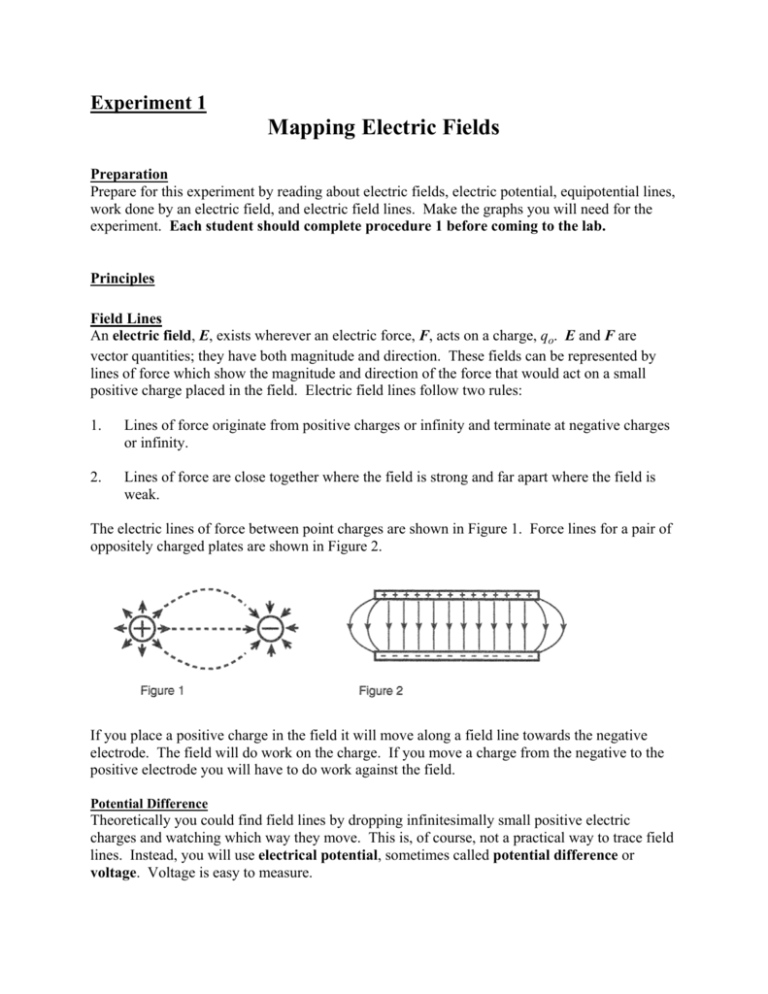
Experiment 1 Mapping Electric Fields Preparation Prepare for this experiment by reading about electric fields, electric potential, equipotential lines, work done by an electric field, and electric field lines. Make the graphs you will need for the experiment. Each student should complete procedure 1 before coming to the lab. Principles Field Lines An electric field, E, exists wherever an electric force, F, acts on a charge, qo. E and F are vector quantities; they have both magnitude and direction. These fields can be represented by lines of force which show the magnitude and direction of the force that would act on a small positive charge placed in the field. Electric field lines follow two rules: 1. Lines of force originate from positive charges or infinity and terminate at negative charges or infinity. 2. Lines of force are close together where the field is strong and far apart where the field is weak. The electric lines of force between point charges are shown in Figure 1. Force lines for a pair of oppositely charged plates are shown in Figure 2. If you place a positive charge in the field it will move along a field line towards the negative electrode. The field will do work on the charge. If you move a charge from the negative to the positive electrode you will have to do work against the field. Potential Difference Theoretically you could find field lines by dropping infinitesimally small positive electric charges and watching which way they move. This is, of course, not a practical way to trace field lines. Instead, you will use electrical potential, sometimes called potential difference or voltage. Voltage is easy to measure. The potential difference, V, between points A and B is defined by: WAB VAB = - q where WAB is the work required to move the charge q from point A to point B. Therefore potential is always measured between two points. Since only the difference matters you can choose any convenient reference point to call zero. This is very similar to gravitational potential energy which is always measured between two points with an arbitrary choice of place to call zero potential energy. For the special case where the electric field is constant: WAB = - F . d . cosθ = - q . E . d . cosθ where d is the distance between points A and B, and θ is the angle between the direction of the displacement vector d and the force F. For a constant field: VAB = E . d . cosθ Equipotential Surfaces and Lines In an electric field you can always find points that are at the same potential relative to the same reference point. The difference in potential between any of these points will then equal zero. In three dimensions a set of these points will lie on what is called an equipotential surface. If you just look at two dimensions of the field, as you will in this experiment, then the points will form an equipotential line. If you know where the equipotential lines are you can infer the electric field lines because electric field lines must always cross equipotential lines at right angles. This is because E and d are not zero so cosθ must equal 0. For cosθ to equal zero, θ must equal 90°. Equipment 1 developing tray 1 plastic grid 2 cylindrical electrodes 2 copper and Plexiglas electrodes 1 multimeter 1 red meter probe 2 2' red banana wires 1 2' black banana wire 2 alligator clips 1 LED float Procedure In this experiment you will investigate the electric field around a pair of cylindrical electrodes and around a pair of flat plates. Each student in a group should do some measuring. Make sure your instructor checks your wiring before you plug anything in. 1. You will need two sheets of 10 lines per centimeter cartesian graph paper. Draw a set of coordinate axes on each piece of paper so that the origin is in the center. Label the long axis X and the short axis Y for each. On one sheet draw two circles 1.3 cm in diameter centered at the points (7.6, 0.0) and (-7.6, 0.0). On the other sheet draw a line between the points (-7.6, 7.6) and (7.6, 7.6) and another line between the points (-7.6, -7.6) and (7.6, 7.6) 2. Place the mounted transparent graph paper in the tray and place the two cylinders at the points (-7.6. 0.0) and (7.6, 0.0). (See Figure 3.) Use a banana wire to connect the electrode at (-7.6, 0.0) to the negative terminal of the power supply. 3. Pour enough water into the tray to cover the tops of the cylinders. Have your instructor check your wiring and then connect the other electrode to the positive power supply output. Do not touch the terminals with your bare skin. If you touch both terminals at the same time you might be mildly shocked. 4. Set the function switch of the multimeter to DC voltage. Push the "Range" button until the display shows one decimal place. Connect one end of a black banana wire to the wire leading to the negative electrode where it emerges from the wall. Plug the other end into the connection marked "COM" on the multimeter. Connect the positive probe to the terminal marked "V-Ω" on the meter. Place the positive probe in the water and move it away from the negative terminal until the meter reads 10 volts. Record this position on your graph paper. Be sure that you keep the positive probe vertical in the water and that you do not press the tip onto the Plexiglas. 5. Move the probe around in the water to find seven or eight more points where the meter reads 10 volts. Be sure you check all around the electrode. Draw a smooth dashed line that best fits the data and label it 10 volts. This is an equipotential line. 6. Find, draw, and label the equipotential lines for 20, 30, and 40 volts. 7. Disconnect the wires from the power supply and remove the cylinders. Place the Plexiglas strips in the pan with the copper strips facing inward so that one is along the line Y = -7.6 and the other is along Y = 7.6. Use alligator clips to connect the wires to the screws holding down the copper strips. Connect the strip at Y = -7.6 to the negative power supply terminal and the other strip to the positive terminal. 8. Repeat procedures 3 - 6 for the copper strips. 9. Look at your equipotential lines and predict where the e-field lines would go. Draw solid lines to represent the electric fields between the two sets of electrodes. Use arrows to indicate the direction of the field. You may have to ask your instructor to turn the room lights down for this part of the experiment. Handle the little LED floats carefully, they are pretty fragile. 10. Put the LED 'float' in the water. The LED will light up when it is pointing in the direction of an electric field line. It will reach maximum brightness when it is exactly along a field line. Use a pencil to point the float along an equipotential line. Does it light up? 11. Now use your pencil to point the float along one of the field lines you drew in on your graph. Does it reach its maximum brightness? 12. Check out the field for both sets of electrodes. Pay particular attention to the areas behind the cylinders and to the sides of the flat electrodes. 13. Disconnect the wires, remove the strips and empty the water from the tray. Put the equipment away neatly. The graphs with the correct equipotential and field lines are worth 10 points.
