160
Values-Based Investing
Values and performance: no contradiction
120
80
40
0
Mar Sep Mar Sep Mar Sep Mar Sep Mar Sep Mar Sep Mar Sep Mar
06 06 07 07 08 08 09 09 10 10 11 11 12 12 13
Behaving in a socially and environmentally
responsible way makes business sense
The business case for companies to behave in a socially
and environmentally responsible way – often called
corporate social responsibility (CSR) – appears quite
clear. Prudent management of the environmental and
social aspects of running a company helps increase efficiency and reduce operational costs. It can contribute
to attracting and retaining employees, enhancing the
company’s reputation and reducing its exposure to risk.
It can also help uncover the commercial opportunities
inherent in today’s environmental and social challenges.
But is there any evidence that such virtuous behavior is rewarded by the stock market? The tricky issue
with CSR is that there is often no clearcut correlation
between effort and effect. The benefits are not always
easy to quantify and often become evident only over
the long term. Many CSR-related activities require longterm investments, and these are not always easy to
reconcile with the short-term nature of certain shareholders’ demands.
Opposing theories – who is right?
Proponents of values-based and socially responsible
investment claim that portfolios which integrate social
and environmental performance alongside financial criteria outperform their conventional peers. This is based
on the hypothesis that 1) CSR makes good business
sense; and 2) information regarding companies’ CSR
performance is not common market knowledge, and
hence not properly integrated into financial models. For
these reasons, companies practicing CSR may be underpriced by the stock market. Screening portfolios using
the principles of socially responsible investing (SRI), the
argument goes, can therefore add value and help portfolio managers to generate better risk-adjusted returns
than “conventional” managers.
Studies performed by SRI research providers support
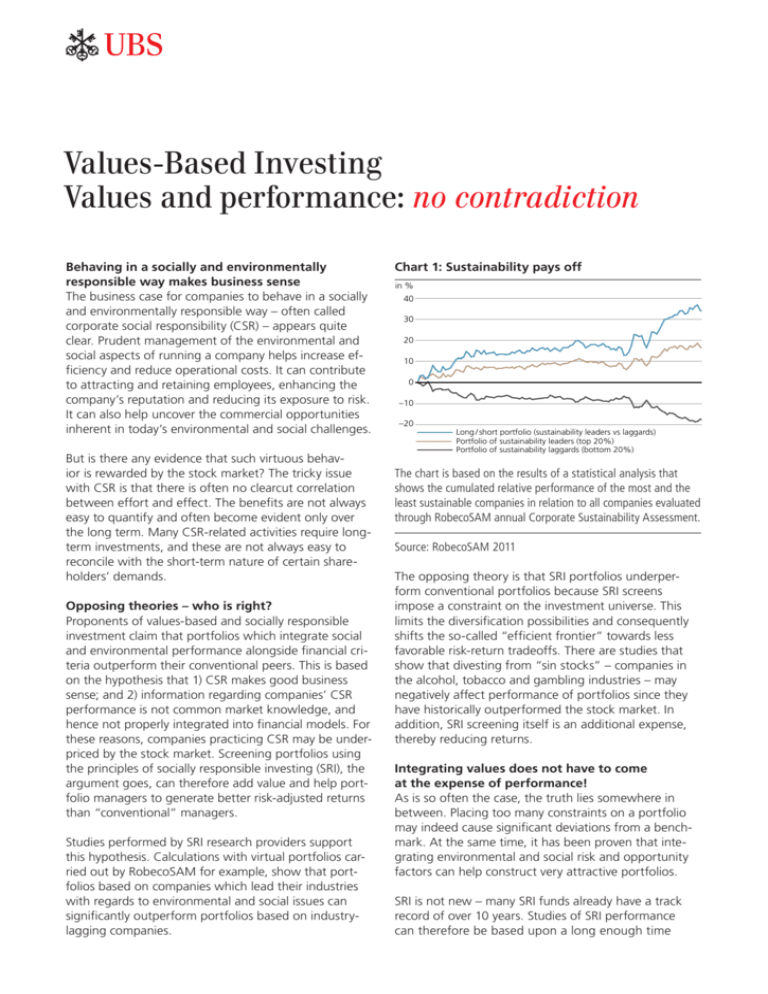
this hypothesis. Calculations with virtual portfolios carried out by RobecoSAM for example, show that portfolios based on companies which lead their industries
with regards to environmental and social issues can
significantly outperform portfolios based on industrylagging companies.
Fund 1 (Total Return EUR)
Fund 2 (Total Return EUR)
ChartFund
1: 3Sustainability
pays
off CLEAN ENERGY (Total Return EUR)
(Total Return EUR)
S&P GLOBAL
in %
40
30
20
10
0
160
–10
120
–20
80
40
Long / short portfolio (sustainability leaders vs laggards)
Portfolio of sustainability leaders (top 20%)
Portfolio of sustainability laggards (bottom 20%)
The
0 chart is based on the results of a statistical analysis that
Mar Sep
Mar Sep Marrelative
Sep Mar
Sep Mar SepofMar
shows
the cumulated
performance
the Sep
mostMarandSeptheMar
06 06 07 07 08 08 09 09 10 10 11 11 12 12 13
least sustainable companies in relation to all companies evaluated
Fund 1 (Total Return EUR)
Fund 2 (Total Return EUR)
throughFund
RobecoSAM
Corporate
Assessment.
3 (Total Returnannual
EUR)
S&P GLOBALSustainability
CLEAN ENERGY (Total
Return EUR)
Source: RobecoSAM 2011
The opposing theory is that SRI portfolios underperform conventional portfolios because SRI screens
impose a constraint on the investment universe. This
limits the diversification possibilities and consequently
shifts the so-called “efficient frontier” towards less
favorable risk-return tradeoffs. There are studies that
show that divesting from “sin stocks” – companies in
the alcohol, tobacco and gambling industries – may
negatively affect performance of portfolios since they
have historically outperformed the stock market. In
addition, SRI screening itself is an additional expense,
thereby reducing returns.
Integrating values does not have to come
at the expense of performance!
As is so often the case, the truth lies somewhere in
between. Placing too many constraints on a portfolio
may indeed cause significant deviations from a benchmark. At the same time, it has been proven that integrating environmental and social risk and opportunity
factors can help construct very attractive portfolios.
SRI is not new – many SRI funds already have a track
record of over 10 years. Studies of SRI performance
can therefore be based upon a long enough time
horizon and a large enough number of funds to allow
for meaningful conclusions. It is, however, important
not to compare apples with oranges. When talking
about performance, it is useful to distinguish between
broadly diversified products and thematic products.
The majority of studies on funds conclude that broadly
diversified SRI funds which are managed against a
broad market benchmark and are predominantly invested in large companies (best-inclass funds and funds
with a negative screen) appear to have similar riskadjusted returns as their conventional peers.
Chart 2:Conventional vs. SRI global funds:
similar performance
Annualized performance in %
14.0
12.0
10.0
8.0
6.0
160 4.0
2.0
120 0.0
–2.0
80 –4.0
40
Chart 4:Global clean energy related funds:
big differences
–1Y
–3Y
–5Y
Global Equity Funds (EUR)
–7Y
–10Y
Global Equity SRI Funds (EUR)
Sep Mar Sepdata
Mar isSep
Mar on
Sepglobal
Mar Sep
Mar funds
Sep Mar
Sep Mar
TheMarperformance
based
equity
available
06 06 07 07 08 08 09 09 10 10 11 11 12 12 13
in Europe with benchmark MSCI World and a correlation to the
Fund 1 (Total Return EUR)
Fund 2 (Total Return EUR)
benchmark
of higher than 0.9 over
all time periods.
Fund 3 (Total Return EUR)
S&P GLOBAL CLEAN ENERGY (Total Return EUR)
This is also confirmed by the performance of various
SRI indices, such as the MSCI World SRI Index or FTSE4Good Index, both of which perform roughly in line
with their “conventional” peers. Another illustration of
this similar performance is a comparison between the
MSCI Europe and MSCI SRI Europe indices, see chart
below.
Chart 3:MSCI SRI World vs MSCI World
115
110
105
100
95
90
85
Oct
11
Nov
11
Jan
12
Mar
12
Apr
12
MSCI World SRI (Total Return USD)
Jun
12
Jul
12
80
40
0
Mar Sep Mar Sep Mar Sep Mar Sep Mar Sep Mar Sep Mar Sep Mar
06 06 07 07 08 08 09 09 10 10 11 11 12 12 13
Source: Morningstar / UBS, as of 31.12.2012
Aug
11
160
120
0
80
Jul
11
Products which focus on specific themes seek to invest
in companies whose products and services address
environmental or social issues, for example companies
active in clean energy, energy efficiency, or water treatment. This usually leads to investment in predominantly
small and mid-sized companies with attractive growth
potential. They are usually young and operate in markets that are new and very dynamic. Stock performance
is correspondingly volatile. Such companies often perform very well in times of strong growth and booming
stock markets but may suffer in times of credit constraints and fear of deflation. General statements about
performance of thematic products are difficult due to
the variety of themes and the lack of comparability.
Even within a theme, as illustrated by the chart below,
there are significant differences in terms of performance and volatility. The selected funds all aim to play
clean energy opportunities but have different allocation
of investments to sub-themes (e.g. solar power vs. wind
power or energy efficiency).
Sep
12
Nov
12
Dec
12
MSCI World (Total Return USD)
Source: Datastream, as of 01. 03.2013
Feb
13
Fund 1 (Total Return EUR)
Fund 3 (Total Return EUR)
Fund 2 (Total Return EUR)
S&P GLOBAL CLEAN ENERGY (Total Return EUR)
Source: Datastream, as of 01.03.2013
Challenge: find the best managers
It should come as no surprise that, as with any investment product, SRI products are only as good as their
portfolio managers and the underlying financial analysis. The challenge is to find the best managers for the
respective products.
UBS offers knowledge, advisory and investment
solutions
Having offered SRI solutions for over fifteen years
and gained know-how in impact investing through its
philanthropy services, UBS has a great deal of ValuesBased Investing experience. We can offer a range of
solutions for clients wishing to integrate their values
into their portfolios while taking into consideration
their risk profile and their individual views of ethics
and sustainability.
For further information on UBS Values-Based
Investing solutions please contact us at
sh-vbi@ubs.com or ask your client advisor.
UBS Values-Based Investing, March 2013
© UBS 2013. All rights reserved.


