The Three Factors that Affect Japan's Climate: Worksheet
advertisement
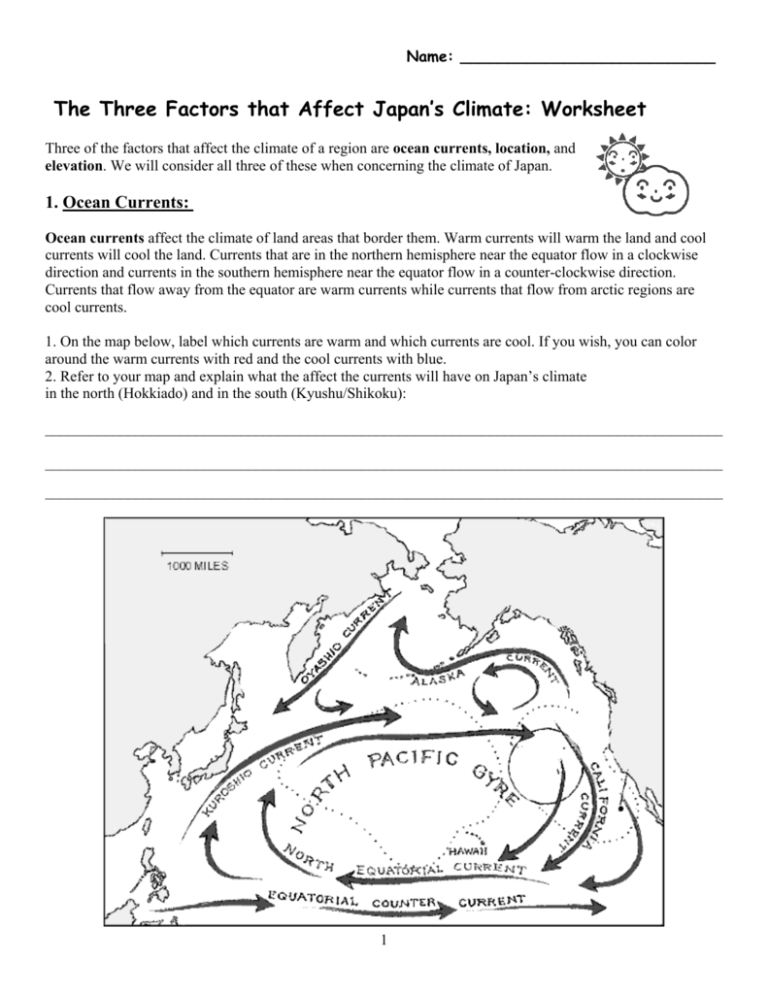
Name: ___________________________ The Three Factors that Affect Japan’s Climate: Worksheet Three of the factors that affect the climate of a region are ocean currents, location, and elevation. We will consider all three of these when concerning the climate of Japan. 1. Ocean Currents: Ocean currents affect the climate of land areas that border them. Warm currents will warm the land and cool currents will cool the land. Currents that are in the northern hemisphere near the equator flow in a clockwise direction and currents in the southern hemisphere near the equator flow in a counter-clockwise direction. Currents that flow away from the equator are warm currents while currents that flow from arctic regions are cool currents. 1. On the map below, label which currents are warm and which currents are cool. If you wish, you can color around the warm currents with red and the cool currents with blue. 2. Refer to your map and explain what the affect the currents will have on Japan’s climate in the north (Hokkiado) and in the south (Kyushu/Shikoku): __________________________________________________________________________________________ __________________________________________________________________________________________ __________________________________________________________________________________________ 1 2. Location: The location of an area in reference to the equator, also affects climate temperatures; generally speaking the higher the latitude, the cooler the climate temperatures. Refer to the map of Japan below (or the one in your handout), would the climate temperature in north western Hokkaido compare to the climate temperature of the Victoria, BC on Vancouver Island? In what way? __________________________________________________________________________________________ __________________________________________________________________________________________ __________________________________________________________________________________________ 2 3. Elevation Elevation is the third factor we will be considering in predicting the climate of Japan. Elevation measures the distance an area is from sea level. When elevation increases the average temperature decreases. Referring to the physical relief map of Japan below, name one area (example: island, mountain, or city) in Japan that may be warm and one area that may be Cool. __________________________________________________________________________________________ __________________________________________________________________________________________ __________________________________________________________________________________________ 3 Victoria, BC: Jan Feb Mar Apr May Jun Jul Aug Sep Oct Nov Dec Year Avg. Monthly Average Temperature(°C) 5 6 8 10 12 14 16 17 15 11 7 5 11 Total Monthly Precipitation (mm) 94 72 47 29 26 21 14 20 27 51 99 109 608 Jan Feb Mar Apr May Jun Jul Aug Sep Oct Nov Dec Year Avg. Monthly Average Temperature(°C) 4 5 8 13 18 21 25 27 23 17 12 7 15 Total Monthly Precipitation (mm) 51 69 108 128 143 172 141 149 216 192 96 53 1518 (Temperature & Precipitation) Tokyo, Japan: (Temperature & Precipitation) Study the two Charts above and answer the following questions. Describe the differences between Victoria’s monthly average temperature and Tokyo’s monthly average temperature. __________________________________________________________________________________________ __________________________________________________________________________________________ __________________________________________________________________________________________ Describe the differences between Victoria’s total monthly precipitation and Tokyo’s total monthly precipitation. __________________________________________________________________________________________ __________________________________________________________________________________________ __________________________________________________________________________________________ 4 Draw a bar graph and line graph: On the empty graph below, record Victoria’s Monthly average temperature and total monthly precipitation. Follow the example provided below for the Japanese cities Sapporo and Tokyo. Example: 200 Millimeters 250 30 25 Celsius 20 150 15 100 10 50 5 Month 1 2 3 4 5 6 7 5 8 9 10 11 12 Month
