Theory
advertisement
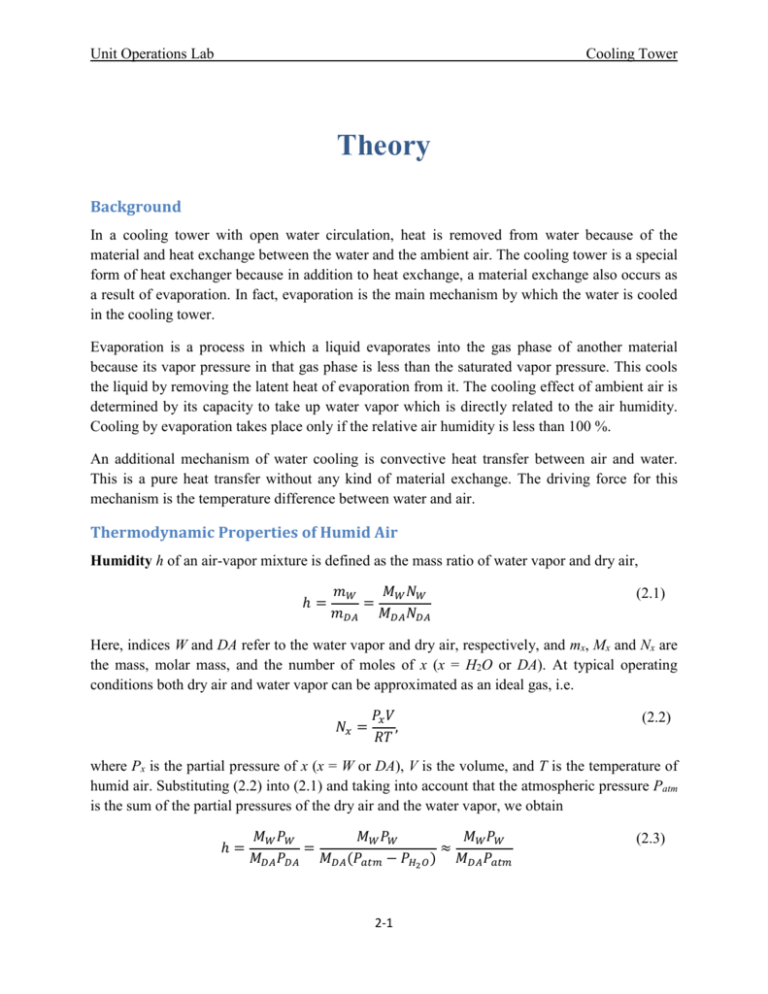
Unit Operations Lab Cooling Tower Theory Background In a cooling tower with open water circulation, heat is removed from water because of the material and heat exchange between the water and the ambient air. The cooling tower is a special form of heat exchanger because in addition to heat exchange, a material exchange also occurs as a result of evaporation. In fact, evaporation is the main mechanism by which the water is cooled in the cooling tower. Evaporation is a process in which a liquid evaporates into the gas phase of another material because its vapor pressure in that gas phase is less than the saturated vapor pressure. This cools the liquid by removing the latent heat of evaporation from it. The cooling effect of ambient air is determined by its capacity to take up water vapor which is directly related to the air humidity. Cooling by evaporation takes place only if the relative air humidity is less than 100 %. An additional mechanism of water cooling is convective heat transfer between air and water. This is a pure heat transfer without any kind of material exchange. The driving force for this mechanism is the temperature difference between water and air. Thermodynamic Properties of Humid Air Humidity h of an air-vapor mixture is defined as the mass ratio of water vapor and dry air, ℎ= 𝑚𝑊 𝑀𝑊 𝑁𝑊 = 𝑚𝐷𝐴 𝑀𝐷𝐴 𝑁𝐷𝐴 (2.1) Here, indices W and DA refer to the water vapor and dry air, respectively, and mx, Mx and Nx are the mass, molar mass, and the number of moles of x (x = H2O or DA). At typical operating conditions both dry air and water vapor can be approximated as an ideal gas, i.e. 𝑁𝑥 = 𝑃𝑥 𝑉 , 𝑅𝑇 (2.2) where Px is the partial pressure of x (x = W or DA), V is the volume, and T is the temperature of humid air. Substituting (2.2) into (2.1) and taking into account that the atmospheric pressure Patm is the sum of the partial pressures of the dry air and the water vapor, we obtain ℎ= 𝑀𝑊 𝑃𝑊 𝑀𝑊 𝑃𝑊 𝑀𝑊 𝑃𝑊 = ≈ 𝑀𝐷𝐴 𝑃𝐷𝐴 𝑀𝐷𝐴 (𝑃𝑎𝑡𝑚 − 𝑃𝐻2 𝑂 ) 𝑀𝐷𝐴 𝑃𝑎𝑡𝑚 2-1 (2.3) Unit Operations Lab Cooling Tower The last equality in (2.3) follows from the fact that 𝑃𝑊 ≪ 𝑃𝑎𝑡𝑚 . We can use a similar approximation to relate the mass fraction y of water vapor in air to humidity, 𝑦= 𝑚𝑊 𝑚𝑤 ≈ =ℎ 𝑚𝑊 + 𝑚𝐷𝐴 𝑚𝐷𝐴 (2.4) Saturation humidity hS(T) at temperature T is the humidity corresponding to equilibrium between humid air and liquid water at this temperature. Relative humidity is ℎ𝑅 = 𝑃𝑊 · 100 %. 𝑃𝑊𝑠𝑎𝑡 (2.5) Where 𝑃𝑠𝑎𝑡 𝑊 is the partial pressure of water vapor in saturated air. Specific enthalpy of humid air is 𝐻𝐺 [ 𝑘𝐽 ] = 𝐻0 + 𝐶𝐺 (𝑇 − 𝑇0 ) + 𝜆ℎ, 𝑘𝑔 𝑑𝑟𝑦 𝑎𝑖𝑟 (2.6) where λ is the latent heat of water (kJ/kg water vapor), H0 and T0 are the reference enthalpy and temperature, and C is the heat capacity of the humid air, 𝐶𝐺 [ 𝑘𝐽 ] = 𝐶𝐷𝐴 + 𝐶𝑊 ℎ (𝑘𝑔 𝑑𝑟𝑦 𝑎𝑖𝑟)𝐾 (2.7) Here, CDA ≈ 1.005 kJ/(kg dry air)·K and CW ≈ 1.88 kJ/(kg water vapor)·K are the heat capacities of dry air and water vapor. The thermodynamic properties of humid air are summarized in the chart shown in Figure 2-1. Wet bulb temperature Twb(T,h) of air at temperature T and humidity h is the temperature of saturated air that would be obtained by an adiabatic evaporation of water initially at the same temperature T as the air. If the water to be evaporated is already at the same temperature as the air, all it needs for evaporation is the supply of latent heat, which is taken from the air by reduction of its temperature. Wet bulb temperature of air at the inlet of the cooling tower represents the lowest temperature (cooling limit) that can be achieved due to evaporation. The wet bulb temperature can be obtained from the thermodynamic chart in Figure 2-1 by following the constant-enthalpy line starting at the given T and h until the saturation line. For example, the wet bulb temperature of air at T = 17°C and humidity h = 6.2 g/kg is Twb =11.2°C. 2-2 Unit Operations Lab Cooling Tower Figure 2-1. Thermodynamic properties of humid air. 2-3 Unit Operations Lab Cooling Tower Characteristic Variables of a Cooling Tower Cooling Limit is the wet bulb temperature of ambient air Wet Bulb Approach is defined as 𝑎 = 𝑇𝐿,𝑜𝑢𝑡 − 𝑇𝑤𝑏 , (2.8) where TL,out is the water temperature at the cooling tower outlet and Twb is the wet bulb temperature. Each cooling tower has its own wet bulb approach. For example under certain climatic conditions the minimum wet bulb approach for open cooling towers in industrial applications could be between 3 and 5 K. The final temperature of water leaving the cooling tower depends on the temperature of the cooling medium (air) and the design of the cooling tower. Cooling Range z is the difference between the warm water temperature at the inlet to the cooling tower and the cold water temperature at the outlet from the cooling tower, 𝜁 = 𝑇𝐿,𝑖𝑛 − 𝑇𝐿,𝑜𝑢𝑡 , (2.9) where TL,in is the inlet water temperature. Cooling Coefficient is defined as 𝜂= 𝑇𝐿,𝑖𝑛 − 𝑇𝐿,𝑜𝑢𝑡 𝑇𝐿,𝑖𝑛 − 𝑇wb (2.10) Water Loss due to evaporation, ∆𝐿̇ = ṁ𝐺 (ℎ𝑜𝑢𝑡 − ℎ𝑖𝑛 ), (2.11) here ṁ𝐺 is the mass flow rate of air and hout and hin are the absolute humidities of air at the inlet and outlet, respectively. Heat Load is the rate of energy transfer from water to air, 𝑄̇𝑊 = ṁ𝐿 𝐶𝐿 (𝑇𝐿,𝑖𝑛 − 𝑇𝐿,𝑜𝑢𝑡 ) (2.12) where ṁ𝐿 and CL are the mass flow rate and the heat capacity of liquid water, respectively. Packing Density is the ratio of the surface areas of all levels of the cooling column to the column volume. Packing density is measured in the units of m2/m3. 2-4 Unit Operations Lab Cooling Tower Material and Energy Flows The material and energy flows at the interface are summarized in Figure 2-2. Material flow: Water vapor diffuses from the interface to the bulk gas phase because humidity at in bulk air is lower than the interface. The driving force for this diffusion is (hI – hG). Energy flows: 1. Water phase: Sensible heat flows from the bulk liquid to the water-air interface; the driving force for this thermal transfer is TL –TI 2. Gas Phase: a. Sensible heat flows from the interface to the bulk gas phase; the driving force for this thermal transfer is TI – TG. b. Latent heat of evaporation flows from the interface to the bulk phase. The sensible heat flowing from liquid to the interface equals the sensible heat flow in the gas plus the latent heat flow in the gas. Note that the direction of the sensible heat flow in gas changes along the column: in the upper part of the column, the interface temperature is higher than that of air and, hence, heat flows from the interface to air. In the lower part of the column, the air temperature may be higher than the temperature at the interface. Hence, the sensible heat flows from air to the interface. However, the latent heat still flows from the interface to the bulk gas phase, thus removing heat from water. Figure 2-2. Temperature and concentration profiles at the air-water interface in a cooling tower. The energy and material flows across the interface are shown by the blue and red arrows, respectively. WET COOLING TOWE 2-5 Unit Operations Lab Cooling Tower Analysis of Cooling Towers Schematics of a cooling tower is shown Figure 2-3. Assume that the rate of water loss is much smaller than the water flow rate, i.e. L≈const. Furthermore, we assume that the water heat capacity CL remains constant throughout the column. G (kg dry air/s·m2) = air flow rate per unit area L (kg/s·m2) = flow rate of liquid water per unit area HG (J/kg dry air) = specific enthalpy of wet air HL (J/kg) = specific enthalpy of liquid water TL (K) = temperature of liquid water CL (J/kg·K) = heat capacity of liquid water Figure 2-3. Schematics of a cooling tower Consider energy balance for a small volume of wet air in the cooling tower: 𝐺[𝐻𝐺 (𝑧 + 𝑑𝑧) − 𝐻𝐺 (𝑧)] = 𝑘𝐺 𝑎[𝐻𝐼,𝐺 (𝑧) − 𝐻𝐺 (𝑧)]𝑑𝑧. (2.13) Here, HI,G is the specific enthalpy of wet air at the air-water interface, kGa (kg/s·m3) is the mass transfer rate per unit volume of packing, and dz is the height of the volume element. The righthand side of Eq. (2.13) represents the energy transfer due to convection between air-water interfaces and the bulk air. After rearranging and integrating Eq. (2.13), we obtain 𝑍 𝐻𝐺,𝑜𝑢𝑡 𝐺 𝑍 = ∫ 𝑑𝑧 = ∫ 𝑘𝐺 𝑎 0 𝐻𝐺,𝑖𝑛 𝑑𝐻𝐺 (𝑧) = ℎ𝐺 𝑛𝐺 𝐻𝐼,𝐺 (𝑧) − 𝐻𝐺 (𝑧) Here, Z is the height of the packing, 2-6 (2.14) Unit Operations Lab Cooling Tower ℎ𝐺 = 𝐺 𝑘𝐺 𝑎 (2.15) 𝑑𝐻𝐺 𝐻𝐼,𝐺 − 𝐻𝐺 (2.16) is the height of a transfer unit and 𝐻𝐺,𝑜𝑢𝑡 𝑛𝐺 = ∫ 𝐻𝐺,𝑖𝑛 is the number of transfer units in the column. The height of a transfer unit is a measure of effectiveness of the packing in the cooling tower in facilitating mass transfer of water vapor into air. The number of transfer units is a measure of difficulty of mass transfer of water vapor into air for the given operating conditions of the cooling tower. It is more convenient to use the overall mass transfer coefficient KGa instead of the film mass transfer coefficient kGa. In this case, the energy balance (2.13) can be rewritten as follows: 𝐺[𝐻𝐺 (𝑧 + 𝑑𝑧) − 𝐻𝐺 (𝑧)] = 𝐾𝐺 𝑎[𝐻𝐺∗ (𝑧) − 𝐻𝐺 (𝑧)]𝑑𝑧, (2.17) where 𝐻𝐺∗ (𝑧) is the enthalpy of the saturated air that would be in equilibrium with water at height z within the column. Using Eq. (2.17), we obtain the following expression for the height of the packing: 𝑍 = ℎ𝑂𝐺 𝑛𝑂𝐺 , (2.18) where ℎ𝑂𝐺 = 𝐺 𝐾𝐺 𝑎 (2.19) is the height of a transfer unit and 𝐻𝐺,𝑜𝑢𝑡 𝑛𝑂𝐺 = ∫ 𝐻𝐺,𝑖𝑛 𝑑𝐻𝐺 ∗ 𝐻𝐺 − 𝐻𝐺 (2.20) is the number of transfer units based on the overall mass transfer coefficient. The integration in (2.20) can be performed numerically, e.g., using the trapezoidal rule: 𝐻𝐺,𝑜𝑢𝑡 ∫ 𝐻𝐺,𝑖𝑛 𝑁−1 𝑓(𝐻𝐺 )𝑑𝐻𝐺 = ∑ [ 𝑘=1 𝑓(𝐻𝐺,𝑘 ) + 𝑓(𝐻𝐺,𝑘+1 ) ] 𝛥𝐻𝐺 , 2 where 2-7 (2.21) Unit Operations Lab Cooling Tower 𝑓(𝐻𝐺 ) = 𝛥𝐻𝐺 = 1 𝐻𝐺∗ (𝐻𝐺 ) − 𝐻𝐺 , (2.22) 𝐻𝐺,𝑜𝑢𝑡 − 𝐻𝐺,𝑖𝑛 , 𝑁−1 (2.23) and 𝐻𝐺,𝑘 = 𝐻𝐺,𝑖𝑛 + (𝑘 − 1)𝛥𝐻𝐺 (2.24) 𝐻𝐺,1 = 𝐻𝐺,𝑖𝑛 and 𝐻𝐺,𝑁 = 𝐻𝐺,𝑜𝑢𝑡 (2.25) In particular, To perform the integration (2.21), we need to obtain the relationship between 𝐻𝐺 (𝑧) and 𝐻𝐺∗ (𝑧). To do this, we need to obtain the liquid temperature TL(z) at height z of the column. This can be done using the energy balance for the area inside the dashed rectangle in Figure 2-3: 𝐺[𝐻𝐺,𝑖𝑛 − 𝐻𝐺 (𝑧)] = 𝐿[𝑇𝐿,𝑜𝑢𝑡 − 𝑇𝐿 (𝑧)] (2.26) Once the liquid temperature TL(z) is known, we can obtain enthalpy 𝐻𝐺∗ (𝑧) of saturated (100% humidity) air at this temperature either from the psychrometric chart or from Eqs. (2.6), (2.7)1. This will allow us to generate a table similar to the one below: 𝐻𝐺 (𝑧) 𝐻𝐺,1 = 𝐻𝐺,𝑖𝑛 𝐻𝐺,2 = 𝐻𝐺,𝑖𝑛 + Δ𝐻𝐺 … 𝐻𝐺,𝑁 = 𝐻𝐺,𝑜𝑢𝑡 𝑇𝐿 (𝑧) 𝑇𝐿,1 = 𝑇𝐿,𝑜𝑢𝑡 𝑇𝐿,2 … 𝑇𝐿,𝑖𝑛 ∗ 𝐻𝐺,1 ∗ 𝐻𝐺,2 ∗ 𝐻𝐺,𝑁 𝐻𝐺∗ (𝑧) = 𝐻𝐺∗ (𝑇𝐿,1 ) = 𝐻𝐺∗ (𝑇𝐿,2 ) … = 𝐻𝐺∗ (𝑇𝐿,𝑁 ) This table provides the relationship between 𝐻𝐺 and 𝐻𝐺∗ , which can be used to obtain 𝑓(𝐻𝐺 ) and perform the integration (2.21). 1 Recall that h in Eqs. (2.6), (2.7) is the absolute humidity. 2-8


