Comparison of modeling studies used to estimate air toxics health risk
advertisement
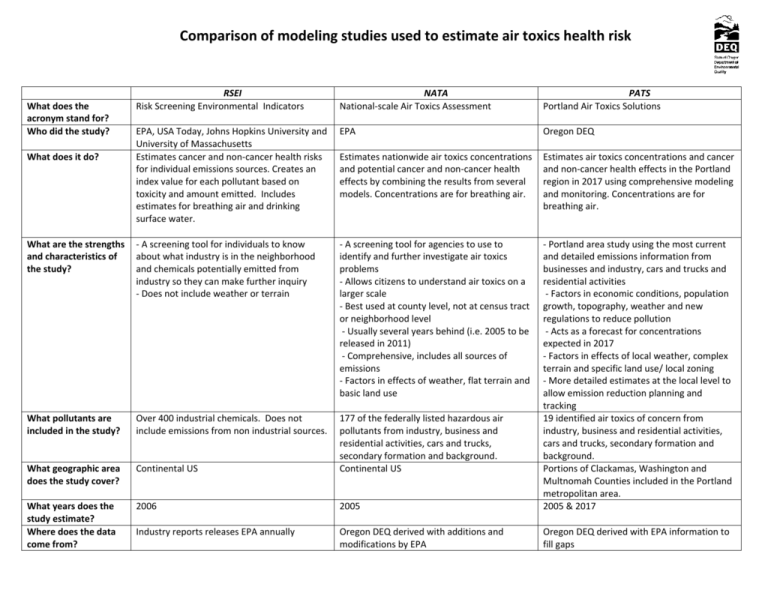
Comparison of modeling studies used to estimate air toxics health risk RSEI Risk Screening Environmental Indicators NATA National-scale Air Toxics Assessment PATS Portland Air Toxics Solutions EPA, USA Today, Johns Hopkins University and University of Massachusetts Estimates cancer and non-cancer health risks for individual emissions sources. Creates an index value for each pollutant based on toxicity and amount emitted. Includes estimates for breathing air and drinking surface water. EPA Oregon DEQ Estimates nationwide air toxics concentrations and potential cancer and non-cancer health effects by combining the results from several models. Concentrations are for breathing air. Estimates air toxics concentrations and cancer and non-cancer health effects in the Portland region in 2017 using comprehensive modeling and monitoring. Concentrations are for breathing air. What are the strengths and characteristics of the study? - A screening tool for individuals to know about what industry is in the neighborhood and chemicals potentially emitted from industry so they can make further inquiry - Does not include weather or terrain - A screening tool for agencies to use to identify and further investigate air toxics problems - Allows citizens to understand air toxics on a larger scale - Best used at county level, not at census tract or neighborhood level - Usually several years behind (i.e. 2005 to be released in 2011) - Comprehensive, includes all sources of emissions - Factors in effects of weather, flat terrain and basic land use What pollutants are included in the study? Over 400 industrial chemicals. Does not include emissions from non industrial sources. What geographic area does the study cover? Continental US 177 of the federally listed hazardous air pollutants from industry, business and residential activities, cars and trucks, secondary formation and background. Continental US What years does the study estimate? Where does the data come from? 2006 2005 - Portland area study using the most current and detailed emissions information from businesses and industry, cars and trucks and residential activities - Factors in economic conditions, population growth, topography, weather and new regulations to reduce pollution - Acts as a forecast for concentrations expected in 2017 - Factors in effects of local weather, complex terrain and specific land use/ local zoning - More detailed estimates at the local level to allow emission reduction planning and tracking 19 identified air toxics of concern from industry, business and residential activities, cars and trucks, secondary formation and background. Portions of Clackamas, Washington and Multnomah Counties included in the Portland metropolitan area. 2005 & 2017 Industry reports releases EPA annually Oregon DEQ derived with additions and modifications by EPA Oregon DEQ derived with EPA information to fill gaps What does the acronym stand for? Who did the study? What does it do?
