The Restaurant Research Thermometer
Taking the Temperature of the Restaurant Industry
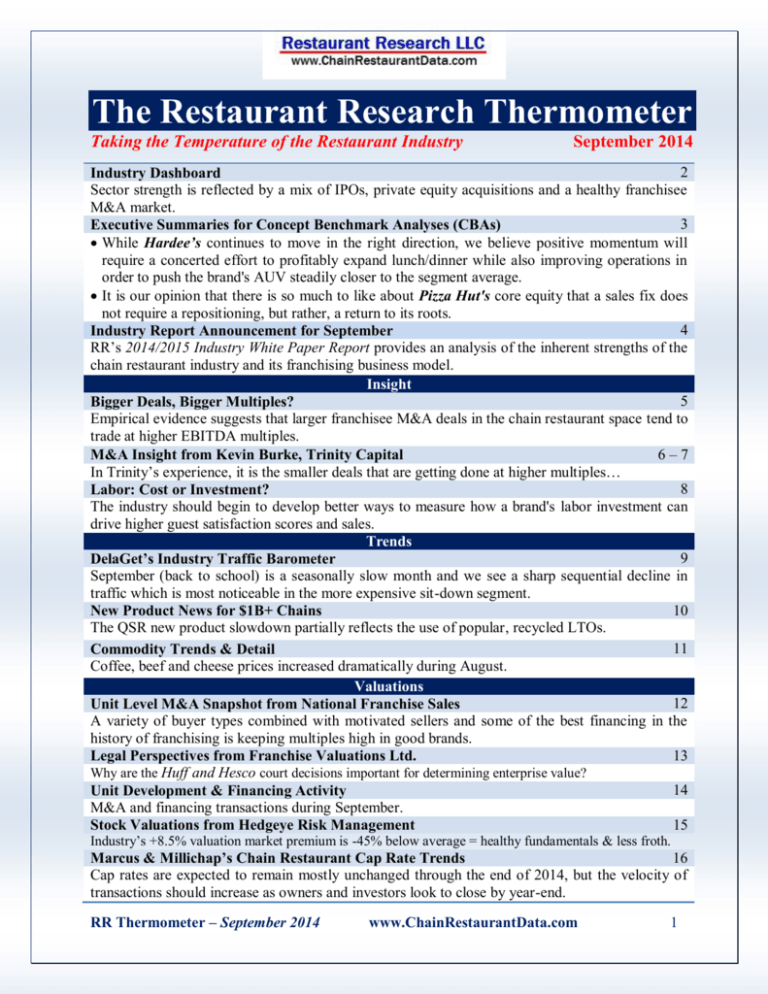
September 2014
2
Industry Dashboard
Sector strength is reflected by a mix of IPOs, private equity acquisitions and a healthy franchisee
M&A market.
3
Executive Summaries for Concept Benchmark Analyses (CBAs)
While Hardee’s continues to move in the right direction, we believe positive momentum will
require a concerted effort to profitably expand lunch/dinner while also improving operations in
order to push the brand's AUV steadily closer to the segment average.
It is our opinion that there is so much to like about Pizza Hut's core equity that a sales fix does
not require a repositioning, but rather, a return to its roots.
4
Industry Report Announcement for September
RR’s 2014/2015 Industry White Paper Report provides an analysis of the inherent strengths of the
chain restaurant industry and its franchising business model.
Insight
5
Bigger Deals, Bigger Multiples?
Empirical evidence suggests that larger franchisee M&A deals in the chain restaurant space tend to
trade at higher EBITDA multiples.
6–7
M&A Insight from Kevin Burke, Trinity Capital
In Trinity’s experience, it is the smaller deals that are getting done at higher multiples…
8
Labor: Cost or Investment?
The industry should begin to develop better ways to measure how a brand's labor investment can
drive higher guest satisfaction scores and sales.
Trends
9
DelaGet’s Industry Traffic Barometer
September (back to school) is a seasonally slow month and we see a sharp sequential decline in
traffic which is most noticeable in the more expensive sit-down segment.
10
New Product News for $1B+ Chains
The QSR new product slowdown partially reflects the use of popular, recycled LTOs.
11
Commodity Trends & Detail
Coffee, beef and cheese prices increased dramatically during August.
Valuations
12
Unit Level M&A Snapshot from National Franchise Sales
A variety of buyer types combined with motivated sellers and some of the best financing in the
history of franchising is keeping multiples high in good brands.
13
Legal Perspectives from Franchise Valuations Ltd.
Why are the Huff and Hesco court decisions important for determining enterprise value?
14
Unit Development & Financing Activity
M&A and financing transactions during September.
15
Stock Valuations from Hedgeye Risk Management
Industry’s +8.5% valuation market premium is -45% below average = healthy fundamentals & less froth.
16
Marcus & Millichap’s Chain Restaurant Cap Rate Trends
Cap rates are expected to remain mostly unchanged through the end of 2014, but the velocity of
transactions should increase as owners and investors look to close by year-end.
RR Thermometer – September 2014
www.ChainRestaurantData.com
1
Industry Dashboard – September Overview
Sector strength is reflected by a mix of IPOs, private equity acquisitions and a healthy franchisee M&A
market. Restaurant stocks started to outperform again in September during a seasonally slow back-toschool season which is a good sign given a relatively weak YTD performance. While food costs
continue to hurt, consumers may be beginning to show signs of life.
Stock Performance
RR Thermometer – September 2014
www.ChainRestaurantData.com
2
Hardee’s
2013 US System Sales: $2.0B
2013 Growth: +3.2%
Today's Hardee's offers a higher-end QSR experience that includes made-from-scratch breakfast
biscuits, made-to-order 100% Black Angus burgers, fresh baked buns, hand-breaded chicken tenders
and hand-scooped shakes & malts. While the brand is differentiated by its focus on young, hungry
males, its chicken, turkey and fish offers also appeal to older customers and women. The nice thing
is that Hardee's has been able to transform itself into a more relevant brand without detracting from
its core biscuit breakfast business which still drives almost half of all sales. However, while
Hardee's has been able to drive comps without engaging in margin eroding price competition, sales
trends have been slowing. Further, food margins are under pressure especially as the menu mix
continues to move away from its high margin breakfast business. Hopefully, an increase in ad
spending (which results in a doubling of ad impressions) will help maintain sales (the solution for
every problem). Also, an expected 2014 completion of its remodel program means that the system
condition is in pretty good shape (that is, for a system with a plethora of older stores). In conclusion,
while Hardee’s continues to move in the right direction, we believe positive momentum will
require a concerted effort to profitably expand lunch/dinner while also improving operations in
order to push the brand's AUV steadily closer to the segment average.
Pizza Hut
2013 US System Sales: $5.7B
2013 Growth: +0.0%
Pizza Hut's core equity as the largest segment player is driven by its historic strength in product
innovation that provided first mover advantage in deep dish pizza and gave us the popular stuffed
crust format - we also really like the Wingstreet line and it is our opinion that the brand could easily
do more with this newly developed asset. We believe the system's unique sit-down "Red Roof"
format provides another untapped advantage as the growing carryout industry channel continues to
bring customers back into the stores while pizza represents an affordable dine-in option for groups
relative to casual. However, it seems to us that the brand has lost momentum by focusing on the core
competencies of its competitors rather than building upon its own unique strengths that were once
sufficient to help the brand achieve 46% share of the $1B+ national pizza chain segment 10 years
ago (having since declined to 38% at the end of 2013). Fortunately, soul searching has yielded a new
marketing agency that has worked wonders for Taco Bell and will hopefully return Pizza Hut to its
own path of success. In any case, record high cheese prices create an imperative for the brand to
quickly determine how to move away from discounting as a way to drive traffic (even if it is
designed to build its very important digital platform which requires some catch-up). In conclusion, it
is our opinion that there is so much to like about Pizza Hut's core equity that a sales fix does not
require a repositioning, but rather, a return to its roots.
RR Thermometer – September 2014
www.ChainRestaurantData.com
3
Industry Report Announcement
RR’s 2014/2015 Industry White Paper Report provides an analysis of the inherent strengths of the
chain restaurant industry and its franchising business model.
Industry White Paper Report
For more info on this report, please contact us at
(203) 938-4703 or info@ChainRestaurantData.com
RR Thermometer – September 2014
www.ChainRestaurantData.com
4
Bigger Deals, Bigger Multiples?
Empirical evidence suggests that larger franchisee M&A deals in the chain restaurant space
tend to trade at higher EBITDA multiples.
In general, operators may pay more to control an entire market as this provides them with
more exclusive marketing and pricing decisions. Also, larger deals (especially as it relates to
contiguous stores) may provide operators with corporate overhead cost savings that explain
higher multiples (based on the idea that G&A synergies will generate higher pro-forma post
deal cash flows).
Larger deals also appeal to private equity groups which enjoy lower cost of funds than
franchisees, allowing them to generate comparable IRR goals even after paying higher
multiples (see table below). Smaller private equity firms are incented to grow their
investments sufficiently to attract new, larger private equity firms who may pay even higher
multiples. In turn, some larger private equity firms could look to the public markets (with
their very high multiples) as an exit.
Source: RR's Valuation Report
RR Thermometer – September 2014
www.ChainRestaurantData.com
5
M&A Insight from Kevin Burke, Trinity Capital
In your
experience, are
there examples
when smaller
buyers are
actually paying
higher multiples?
In the leading franchised restaurant concepts we've been selling, the larger deals are
getting done, for the most part, at purchase price multiples between 6.75x and 7.25x,
while the multiples for the smaller deals are materially higher. Smaller franchisee
transactions have been getting done in leading concepts between 7.25x and 7.80x! This
is largely because lenders are willing to stretch for smaller amounts of lending when a
strong balance sheet is involved. The lease-adjusted leverage constraints of financing are
not as oppressive on smaller deals and many of the acquirers of the small deals have
balance sheet capacity to absorb the additional stores and still maintain adequate
financial ratios. In addition, franchisors tend to more carefully scrutinize the financing
and capital structure of larger deals, while with some franchisors, smaller deals proceed
with less oversight.
Don’t private
equity buyers have
all the
advantages?
Strategic acquirers can take on stores with very little material impact to their existing
overhead; whereas, private equity buyers generally don’t have an overhead infrastructure
in place and are therefore responsible for the full burden of G&A expenses. It is
important to note here that a private equity backed restaurant operator can be considered
a strategic acquirer for this discussion. In addition, private equity buyers are tougher
negotiators and more sensitive to purchase price since they are generally exiting in a
shorter investment horizon. PE buyers are also very sensitive to financing and projected
multiple of capital invested and other financial return metrics. To underscore all of this,
in the last 15 restaurant auctions we've run, private equity was the best bid in exactly one
transaction although a material competitor in every instance (except two smaller
deals). Another issue to consider is that some franchisors are starting to get a little bit
wary of institutional ownership and are increasing the scrutiny they put on incoming
investors. Private equity investors have the advantage of capital and are experienced
buyers, but strategic acquirers can draw a line through much of the fixed cost of
operations they acquire and therefore can pay a higher price.
- continued on next page -
RR Thermometer – September 2014
www.ChainRestaurantData.com
6
M&A Insight from Kevin Burke, Trinity Capital - continued
What's going on
with restaurant
sales and will this
affect M&A
purchase price
multiples anytime
soon?
Restaurant sales have been under pressure from grocery stores and changing
demographics. There is a balance between consumer discretionary spending on prepared
and semi-prepared foods in the grocery store and restaurant spending. Both restaurants
and grocery stores are fighting hard to provide convenience, quality and value to their
customers. These qualities are frequently mutually exclusive, highlighting the difficulty
of achieving breakout sales like Chipotle or Whole Foods (during their respective runs).
The grocery stores had their way for a couple of years after the Great Recession;
however, restaurants made a fantastic comeback in the last couple years. Nonetheless,
the consistent loss of traffic in the casual dining space underscores the difficulty of
capturing consumer discretionary spending from working and middle class families with
declining purchasing power. One successful element has been to capture the hearts and
wallets of millennials. Millennials are not wired like preceding generations, and their
tastes and preferences are remarkably different. In addition, they generally have a higher
willingness to spend on food and beverage than other demographic groups. A concept
that can consistently attract millennials will likely outperform its peers. One of the big
struggles McDonald's currently faces, in addition to its busy menu and the difficulty of
comp-ing over very high unit-level sales, is its abysmal performance with millennials.
Apparently, a significant portion of the mainstream millennial set does not believe it is
“cool” to eat at McDonald's. In summation, there is a lot of change within spending and
traffic patterns of restaurant customers, and M&A multiples will remain robust for
leading-edge concepts that continue to grow traffic and will continue to diminish for
concepts that fail to grow their customer base and adapt to changing demographics.
Mr. Burke is the founder and Managing Partner of Trinity Capital. Since its
inception in 2000, Trinity Capital has completed over $20 billion in mergers
and acquisitions, financial restructurings and financing transactions for
restaurant companies. Clients have included such corporations as Taco Bell,
Burger King, Ready Pac, Green Earth Fuels and Yum! Brands and such
private equity firms as The Carlyle Group, Bain Capital, the Thomas H. Lee
Company and Goldman Sachs Capital Partners.
Trinity Capital LLC
11755 Wilshire Blvd., Suite 2450
Los Angeles, CA 90025
Main: 310-268-8330
Direct: 310-231-3100
kburke@trinitycapitalllc.com
RR Thermometer – September 2014
www.ChainRestaurantData.com
7
Labor: Cost or Investment?
The traditional way to analyze labor efficiency is to look at staffing and benefit costs as a %
of sales. In this case, the lower the ratio the better...
But is efficiency the only consideration as it relates to labor? In the hospitality business,
staff efficiency may not be sufficient to drive long-term results. Well trained, talented
people in front of the house positions maybe key to the long-term success of any
hospitality business but this is difficult to quantify, to prove. According to a recent
Darden presentation, only 44% of guests in the casual industry acknowledge "pleasant
friendly service". It is for this reason that we believe it maybe useful for the industry to
consider some other labor metrics.
As we can see below, a ratio of annual labor costs/seats and labor costs per s.f. tell a very
different story than labor costs/sales. The point of these imperfect ratios (which do not
consider drive-thru) is to find a way to better tie labor to customers and/or facilities. In any
case, we would like to suggest that the industry should begin to develop better ways to
measure how a brand's labor investment can drive higher guest satisfaction scores and
sales.
Source: Restaurant Research Estimates
RR Thermometer – September 2014
www.ChainRestaurantData.com
8
DelaGet’s Industry Traffic Barometer
September (back to school) is a seasonally slow month and we see a sharp sequential decline in
traffic which is most noticeable in the more expensive sit-down segment. On a y/y basis, QSR
traffic improved while sit-down traffic declined, prompting more discounts & new news.
DelaGet transaction data for large brands is aggregated
from 4,000+ QSR and 1,700+ sit-down locations
Note: In some cases, gross sales includes sales tax
Source: DelaGet
DelaGet is a trusted partner of multi-unit restaurant operators around the world, servicing more than 10,000
restaurants and processing data associated with more than four billion order items annually. By centralizing and
consolidating the data from numerous point-of-sale, back-of-house, banks, suppliers, drive-thru timers, etc., DelaGet
leverages the data to increase operator efficiency and profitability through its above-store reporting; data integration;
loss prevention; marketing measurement and planning; payroll processing; and general ledger accounting services.
Learn more at www.DelaGet.com.
RR Thermometer – September 2014
www.ChainRestaurantData.com
9
New Product News for $1B+ Chains
September new product news decreased on a y/y basis for QSR while increasing for the sitdown segment which registered the highest number of new products since May.
The QSR new product slowdown partially reflects the use of popular, recycled LTOs that
coincide with the fall/Halloween season. Conversely, Little Caesar’s debuted its first new
product of the year (Pretzel Crust Pizza for $6).
Sit-down’s increase in new products was driven primarily by several additions to Denny’s $2
$4 $6 $8 Value Menu and LTOs at Buffalo Wild Wings.
The number of national TV spots increased +6.5% m/m but national airings declined -12.2%
for the $1B+ chain restaurants.
Source: Restaurant Research Menu & Promotions Database
RR Thermometer – September 2014
www.ChainRestaurantData.com
10
Commodity Trends & Detail
Coffee, beef and cheese prices increased dramatically during August.
Wings, wheat and fresh vegetables (excluding potatoes) continued to post lower Y/Y prices.
According to preliminary September data, both beef and cheese prices continue to rise while
the pace of pork price appreciation is slowing to the high single digits.
Fortunately, feedstock prices are declining which has positive implications for longer-term
commodity prices and we note that corn for September delivery on the Chicago Board of
Trade recently fell to its lowest price since June 2010.
Source: RR’s Commodity Database
RR Thermometer – September 2014
www.ChainRestaurantData.com
11
Unit Level M&A Snapshot from National Franchise Sales
A variety of buyer types combined with motivated sellers and some of the best financing in the
history of franchising is keeping multiples high in good brands.
September 2014
Score
1
2
(5 increasing – 1
decreasing)
Buy-side Demand
4
Sell-side Supply
4
Financing
Availability
4
Valuation
Multiples
4
3
4
5
Comments
Buy-side Demand
Sell-side Supply
Financing
Availability
Valuation
Multiples
Buyers seizing in-brand and complimentary brand acquisitions are being
fueled by inexpensive debt and capital investments by new financial
partners. New entrants into franchising are being supported by
rebounding home equities and the reemergence of active SBA lending.
Weaker Balance Sheet sellers challenged by upcoming capital
improvement requirements and pressure on existing debt make up a
significant part of the market. Additionally, the aging franchise
communities recognize this to be one of the better times to sell.
Lenders remain competitive both in terms of rates and covenants, and are
actively recognizing embedded equity due to increased valuations, thus
allowing established franchisees additional sources of expansion capital.
Valuation multiples are very strong in healthy brands and weak in poor
performing brands, as buyers move to the better brands.
SPECIALIZING IN THE RESALE OF FRANCHISE BUSINESSES SINCE 1978
National Franchise Sales has become an industry leader in franchise business brokerage by successfully
assisting franchisees and franchisors in the acquisition and sale of their businesses since 1978.
Headquartered in Newport Beach, CA with eight offices across the country, NFS is staffed by 25 industry
professionals serving over fifty brands with transactions ranging from the sale of single units, to multi -unit
sales of over 100 units, to refranchising programs, to the sale of Franchise companies .
Alan F. Gallup
National Franchise Sales
RR Thermometer – September 2014
949.428.0483
www.ChainRestaurantData.com
12
Legal Perspectives: Bruce S. Schaeffer, Franchise Valuations Ltd.
Why are the
Huff and Hesco
court decisions
important for
determining
enterprise value?
At issue in both Huff and Hesco: Method for determining enterprise value in a “fair
value” dispute, i.e. what to pay a dissenting shareholder in a forced buyout. In one
case the merger price was adopted; in the other it was rejected.
For many years the Delaware Court of Chancery has been the premier forum for deciding
“fair value” in dissenting shareholder disputes. Traditionally, it has expressed a strong
preference for the discounted cash flow (DCF) method. Yet in Huff v. CKx (2013) the court
expressly rejected the DCF method in favor of the actual merger price in a case which
involved the company that owned “American Idol” and “So You Think You Can Dance”.
The issue came up because after 2006, when the show’s revenues began to decline, the
company was sold for $5.50 per share.
The petitioners’ expert, using a DCF analysis, concluded it was worth $11.02 per share. In
contrast, the company’s expert used the DCF method to come up with a value of$4.41—
$1.09 below the sales price. But, the court found neither treatment was reliable because
when the merger took place, the future revenue streams related to “American Idol,”
the company’s primary asset, were “in a state of flux.” Therefore, the DCF analysis was
not the appropriate technique to be used. Instead, the Court adopted the actual merger price,
which resulted from a sales process that was “thorough, effective, and free from any spectre
of self-interest or disloyalty.”
What are the
implications of
these decisions
for restaurant
operators?
The method for determining “fair value” was again the issue before the same judge, this
time in Laidler v. Hesco (2014). In that subsequent decision involving the buyout of a 10%
shareholder by a 90% shareholder, however, the 90% shareholder did no outside offering of
the enterprise so the Court ruled: “Under our case law, a statutory appraisal is the sole
remedy to which the Petitioner is entitled, and to defer to an interested controlling
stockholder's determination of fair value in a transaction such as this would render that
remedy illusory. I therefore decline to consider the merger price in determining the fair
value of Hesco.” Thus the DCF method was used.
“Fair Value” determinations are important to restaurant operations whenever one of the 3
Ds is present: Death, Disability or Disaffection. A dispute among owners over the value of a
closely held business, where a minority owner feels squeezed out or left out, may give rise
to costly and lengthy litigation. Owners should check their buy-sell agreements in advance
of a dispute to mitigate such risk and provide for a smooth transition.
Bruce S. Schaeffer is a tax attorney and valuation specialist in New York
City. A nationally recognized expert, he has over 30 years’ experience
dealing with tax and estate planning issues, complex transactions, and
valuations and damages disputes for franchises, dealerships and
distributorships. As the founder and president of Franchise Valuations, Ltd.
Mr. Schaeffer provides consulting and testifying expertise on money
damages and valuations.
Franchise Valuations Ltd. - 3 Park Avenue, 15th Floor, NY, NY 10016 - Tel: 212-689-0400
www.franchisevaluations.com
RR Thermometer – September 2014
www.ChainRestaurantData.com
13
Unit Development & Financing Activity during September 2014
M&A and financing transactions during 9/14 from RR’s Unit Development & Financing Activity
Database is outlined below. Clients can find complete database with development deals online.
Source: Restaurant Research Development & Financing Activity Database
RR Thermometer – September 2014
www.ChainRestaurantData.com
14
Stock Valuations from Hedgeye Risk Management
The restaurant industry’s +8.5% valuation market premium is -45% below the average premium
since 2010, revealing still healthy fundamentals and less froth.
Coffee has overtaken Fast Casual as the most expensive
segment on an EV-to-EBITDA basis, helped by BAGL’s
buyout offer. DNKN, KKD, SBUX and THI are all
trading above their average valuations since 2010.
Casual Dining, Fast Casual and Fine Dining stocks are
currently trading at the most compelling valuations
relative to their recent trends.
Howard Penney
Managing Director
HEDGEYE RISK MANAGEMENT
(O) 203-562-6500
(C) 862-217-9429
(E) HPenney@hedgeye.com
RR Thermometer – September 2014
www.ChainRestaurantData.com
15
Marcus & Millichap’s Chain Restaurant Cap Rate Trends
• September cap rates held steady near the August LTM low at 6.33%, representing a -6.6% y/y
decline.
• Cap rates are expected to remain mostly unchanged through the end of 2014, but the velocity of
transactions should increase as owners and investors look to close by year-end.
Source: The Nisbet Group has been specializing in the disposition and acquisition of Net-Leased properties for
the past 15 years under the expertise of Peter Nisbet, the managing partner. By focusing exclusively on the
restaurant product type, The Nisbet Group has formed an unmatched understanding of the unique challenges that
transpire during a transaction while creating solutions to overcome them. The team is recognized as a market
leader for their superior service and outstanding performance by routinely displaying their skills at analyzing
market trends, evaluating properties and resolving issues across the transaction process. This dedicated group
has closed escrow on over 300 properties; earning clients more than $500 million. The Nisbet Group’s success is
made possible through the deployment of market segmentation, innovative approaches, detail orientation, and
cultivated relationships. The group is able to deliver unmatched service to their clients year after year.
For more information please contact Hank Wolfer of The Nisbet Group at (206) 826-5730
RR Thermometer – September 2014
www.ChainRestaurantData.com
16
Please Pass to Your Colleagues
Copyright: This Restaurant Research LLC document is copyrighted material. Copyright 2014 Restaurant Research® LLC. All rights reserved.
Disclosure: Restaurant Research LLC often sells report subscriptions to concepts under our coverage.
Disclaimer of Liability: Although the information in this report has been obtained from sources Restaurant Research® LLC believes to be reliable, RR does not guarantee its accuracy. The views
expressed herein are subject to change without notice and in no case can be considered as an offer or solicitation with regard to the purchase or sales of any securities. Restaurant Research’s
analyses and opinions are not a guarantee of the future performance of any company or individual franchisee. RR disclaims all liability for any misstatements or omissions that occur in the
publication of this report. In making this report available, no client, advisory, fiduciary or professional relationship is implied or established. This report is intended to provide an overview of the
restaurant industry, but cannot be used as a substitute for independent investigations and sound business judgment.
RR Thermometer – September 2014
www.ChainRestaurantData.com
17

