TEVA - Analyst Reports
advertisement
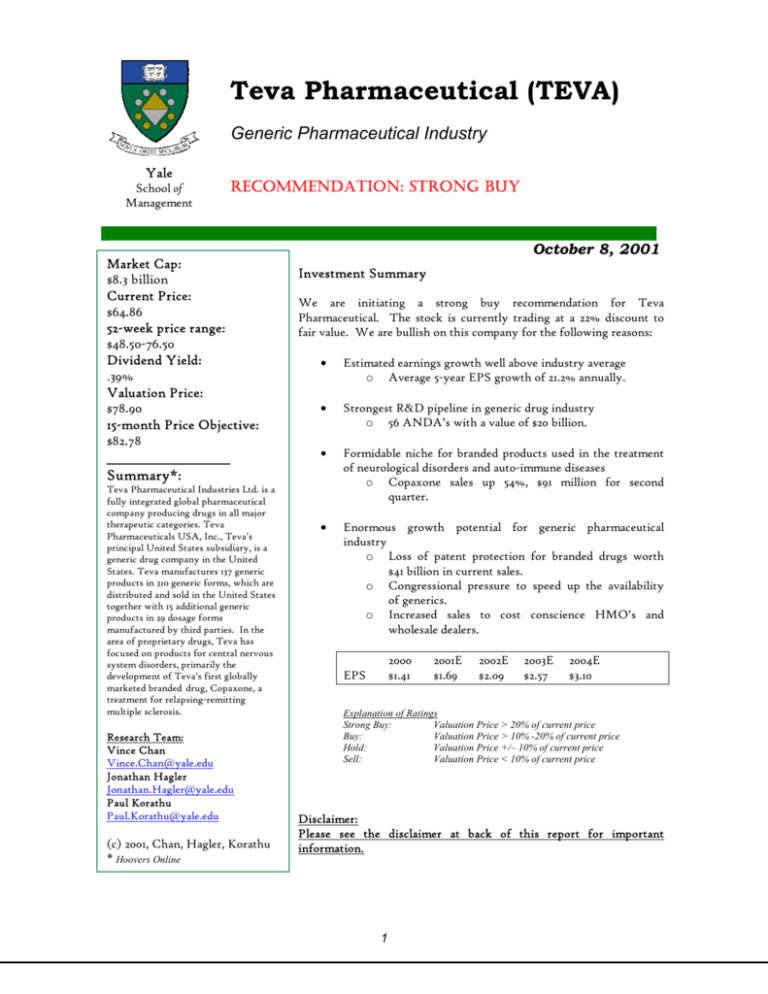
Teva Pharmaceutical (TEVA) Generic Pharmaceutical Industry Yale School of Management RECOMMENDATION: STRONG BUY Market Cap: $8.3 billion Current Price: $64.86 52-week price range: $48.50-76.50 Dividend Yield: .39% Valuation Price: $78.90 15-month Price Objective: $82.78 ____________________ Summary*: Teva Pharmaceutical Industries Ltd. is a fully integrated global pharmaceutical company producing drugs in all major therapeutic categories. Teva Pharmaceuticals USA, Inc., Teva's principal United States subsidiary, is a generic drug company in the United States. Teva manufactures 137 generic products in 210 generic forms, which are distributed and sold in the United States together with 15 additional generic products in 29 dosage forms manufactured by third parties. In the area of proprietary drugs, Teva has focused on products for central nervous system disorders, primarily the development of Teva's first globally marketed branded drug, Copaxone, a treatment for relapsing-remitting multiple sclerosis. Research Team: Vince Chan Vince.Chan@yale.edu Jonathan Hagler Jonathan.Hagler@yale.edu Paul Korathu Paul.Korathu@yale.edu (c) 2001, Chan, Hagler, Korathu * Hoovers Online October 8, 2001 Investment Summary We are initiating a strong buy recommendation for Teva Pharmaceutical. The stock is currently trading at a 22% discount to fair value. We are bullish on this company for the following reasons: · Estimated earnings growth well above industry average o Average 5-year EPS growth of 21.2% annually. · Strongest R&D pipeline in generic drug industry o 56 ANDA’s with a value of $20 billion. · Formidable niche for branded products used in the treatment of neurological disorders and auto-immune diseases o Copaxone sales up 54%, $91 million for second quarter. · Enormous growth potential for generic pharmaceutical industry o Loss of patent protection for branded drugs worth $41 billion in current sales. o Congressional pressure to speed up the availability of generics. o Increased sales to cost conscience HMO’s and wholesale dealers. 2000 $1.41 EPS 2001E $1.69 2002E $2.09 2003E $2.57 2004E $3.10 Explanation of Ratings Strong Buy: Valuation Price > 20% of current price Buy: Valuation Price > 10% -20% of current price Hold: Valuation Price +/– 10% of current price Sell: Valuation Price < 10% of current price Disclaimer: Please see the disclaimer at back of this report for important information. 1 Teva Pharmaceutical October 8, 2001 Yale School of Management Strategy Teva strengths lie in their strategic infrastructure, product diversity, geographic spread and large pipeline. Among its branded products, Teva has developed a niche as a leading manufacturer of products used to treat neurological disorders and autoimmune diseases. The cornerstone is its highly successful Copaxone drug. Like all pharmaceutical companies, Teva’s long-term profitability is contingent on its ability to develop new products. Teva currently has the strongest pipeline relative to their peers, with 56 new drug applications already filed. Teva differentiates itself from its peers by emphasizing R&D and through its global sales and manufacturing infrastructure. Market Share In the U.S. Teva sells 152 generic products in 239 dosage forms. In the UK, Hungary, and Netherlands, Teva sells 270 products in over 600 dosage forms.1 Currently, 18% of sales come from branded drugs, and 82% from generic drugs. According to IMS Health estimates Teva held 11.9% of the global generics market in terms of sales in 2000, placing them above Mylan Labs2. Growth Opportunities In the immediate term, management can exceed current Wall Street expectations by: 1. Launching injectable Copaxone in Europe ahead of schedule and beating global sales expectations for the drug. Global Copaxone sales represented approximately 20% of Teva sales in 2000. The drug is used in treating relapsing-remitting multiple sclerosis and competes in the branded market against Shering’s Betaseron, Biogen’s Avonex, and Serono’s Rebif. The market leader is the Biogen product with nearly twice the sales of Copaxone. Investext reports U.S. 2001E sales of Copaxone of $ 363 MM and outside U.S. sales of $ 145 million. The global sales (including U.S.) for this category are estimated to reach approximately $3.5 billion.3 1 Figures are extracted the Company’s web site. Appendix B. 3 Appendix C. 2 2 Teva Pharmaceutical October 8, 2001 Yale School of Management On August 7th 2001, the company gained European approval for the drug and is awaiting national marketing authorizations, which are expected in the last quarter. During its September 17th 2001 conference call, management assured investors European launch dates are on schedule and have not been effected by the tragedies of September 11th 2001. First European launch will be in Germany. Management’s Augest 15th 2001’s upward revision of EPS for the second half of 2001 reflects higher than expected Copaxone sales. Copaxone should be able to steal market share from the other drugs in its class pursuant to a large multicenter study which showed significant reduction of brain plaques in remittingrelapsing MS patients treated with Copaxone versus placebo. Medical literature supports a strong correlation between brain plaque reduction and disease remission. Likelihood-High. 2. Gaining speedy approval of orally available Copaxone. In 2001, Teva sponsored a Phase III trial for oral Copaxone. Orally available drugs generally have higher patient compliance than injectables, leading to higher sales. Per its September 11th 2001 conference call, management confirmed that the safety committee overseeing the trial had advised Teva to increase its trial dose as the current trial dose did not show statistically significant patient improvement. However, the Company feels the prospects of reaching statistical significance at higher doses are dim. The Company remarked that oral Copaxone sales were not a factor in management EPS guidance, but that trial costs were. Likelihood-Low. In the intermediate term, management can exceed Wall Street expectations by: 1. Beating U.S. ANDA approval expectations for the current fiscal year. ANDA approvals for generic manufacturers vary greatly across firms and across years. In 2000, Teva received approval and launched 18 drugs in the U.S. However in 1999 the figure was 6 and in 1997 it was 14. Generally, top tier companies can be expected to launch 8-12 drugs per year4. To date for the current year, Teva has launched or gained approval for 11 drugs and has gained tentative approval for an additional 3.5 This is irrespective of the Impax Pharma deal. Likelihood-High 4 5 Appendix D. Recent Press Releases. 3 Teva Pharmaceutical October 8, 2001 Yale School of Management 2. Maximally leveraging the Impax Pharma deal. On June 27 2001, Teva signed an agreement with Impax Pharma granting exclusive option rights on 12 Impax products. Deal terms include a $15 million equity participation by Teva. Products optioned represent $5.7 billion in annual U.S. branded sales. Seven of the products fall under Hatch-Waxmann Paragraph IV for 180- day market exclusivity. Likelihood-High In the long term, management can exceed Wall Street expectations by: 1. Beating ANDA filing expectations going forward. Teva’s pipeline is very strong compared to its peers and should allow them to meet launch expectations going forward.6 Likelihood-High 2. Obtaining Paragraph IV exclusivity on some of the high profile drugs coming off patent through to the end of 2005. Although details were not disclosed in the press or conference call, the Impax deal may involve several high profile drugs expected to come off patent. In 2005, drugs totaling $16 billion will be coming off patent.7 Likelihood-To early to tell. Ratio Analysis8 Teva’s sustainable growth rate of 17% in the last fiscal year is on par with the sector. Although this is higher than Watson’s stainable growth rate, Watson is trading at a much higher P/E multiple. The main reason behind this discrepancy is Watson’s end of 2Q00 approval of generic BuSpar, Bristol Myer Squibb’s fifth best selling drug. Watson was granted 180- days of market exclusivity under Paragraph IV of the HatchWaxman Amendment. However, Watson’s P/S ratio is closer to its peers suggesting Watson’s profitability may not be as high as that of Teva or Mylan. In fact this is the case, as Watson’s oneyear profit margin is 6% whereas those for Teva and Mylan are 11% and 18%, respectively. We believe that if Teva were to win 18 months of market exclusivity on a drug with global peak sales of $700 million, that is a BuSpar- like drug, it would not be unreasonable to expect future “Watson-like” multiples, especially given Teva’s superior profit margins. 6 Appendix D. Appendix E. 8 Appendix A. 7 4 Teva Pharmaceutical October 8, 2001 Yale School of Management Teva’s plowback ratio is within range of the sector and its peers. Its return on equity should be higher than it the one year 20%, especially given it relatively high leverage. Its low return on equity is due to its low return on assets, which in turn is due to its low sales turnover, not low profit margins. However, its sales growth has trended upward to a one year 33% from a 17% five-year average. The low sales turnover may be due to poor capital expenditure decisions. In its two most recent analyst conference calls, no mention as made nor no questions directed towards capital expenditures. Idiosyncratic Risk Factors Decrease in Copaxone sales Competitors are conducting clinical trials for drugs, such as Antigen, that can be used as a substitute treatment for Multiple Sclerosis. While management does not put serious weight to these trials, formidable substitutes for their leading product could significantly reduce revenues or profit margins. Furthermore, there may be unanticipated setbacks in European national approvals of Copaxone that could hamper future sales growth. Novapharm acquisition The recent acquisition of this leading Canadian generic drug manufacturer poses a risk to Teva’s profitability if the firm in unable to achieve synergies from the merger or if Teva is unable to retain key Novapharm personnel. Industry Risk Factors New Products Future earnings are dependent on Teva’s ability to successfully develop and commercialize additional generic and branded pharmaceutical products. Due to the intense competition in the generic drug industry, Teva’s inability to be first to market with new products is the greatest risk for future earnings growth. Brand-name Manufacturers Brand-name manufacturers do not face significant barriers to entry into the generic market of their branded drug. Furthermore, these companies can extend brand-name exclusivity through years of litigation or by developing and marketing as over-thecounter products those branded products that are about to face generic competition. 5 Teva Pharmaceutical October 8, 2001 Yale School of Management Legislation Interpretive changes in the Waxman-Hatch Act could affect the FDA’s current policy of 180-day exclusivity for new generic drugs. A decrease in the exclusivity period will have a significant negative impact on future earnings. Furthermore, changes in the rules that govern health-care in the U.S., Europe and Israel could reduce Teva’s profit margins and ability to sustain growth. 6 Teva Pharmaceutical October 8, 2001 Yale School of Management Stock Performance and Volatility Summary Price (October 5 2001): $64.86 52-week range: $46.50-76.50 1-Year Performance: -7.6% Dividend: $.25 per share P/E: 39.6 Shares held by institutions: 51% Share buyback/issuance ratio (12-month share change): -1.9% Insider and restricted shareholder transactions Date 8/15/01 Seller Harold Snyder – Director Beryl Lynn Snyder – Director Beryl Lynn Snyder – Director Stock TEVA ADR – 50,000 TEVA ADR – 5,000 3/26/01 TEVA Ordinary stock – 10,000 Source: Ford Investor Services, Inc. and Yahoo!Finance. Proceed $3,519,500 $351,950 $551,785 Beta Vs. S&P 500 = .49 Vs. S&P Drug = .16 Vs. S&P Healthcare = .26 Volatility 100 Day Historical Standard Deviation: Teva = 40.4%, S&P 500 = 20.68% 5 Year Relative Performance 350% 300% 250% 200% 150% 100% 50% 0% -50% Teva Mylan Watson 7 Sep-01 Mar-01 Sep-00 Mar-00 Sep-99 Mar-99 Sep-98 Mar-98 Sep-97 Mar-97 Sep-96 S&P HealthCare Teva Pharmaceutical October 8, 2001 Yale School of Management 5 Year Relative Performance 300% 250% 200% 150% Teva 100% S&P HealthCare 50% 0% TEVA S&P 500 8 Sep-01 Mar-01 Sep-00 Mar-00 Sep-99 Mar-99 Sep-98 Mar-98 Sep-97 Mar-97 Sep-96 -50% NASDAQ Teva Pharmaceutical October 8, 2001 Yale School of Management Recent Press Releases September 2001 09/26/01- Teva may repurchase from time- to- time up to an aggregate amount of $50 MM of company shares as approved by the Board on May 2000. To date, Teva has purchased 22,000 shares at a cost of $1.3 million (approximate average of $60 per share). Purchases can be made without prior notice in the open NASDAQ or Tel Aviv Stock exchanges. 09/19/01- Launch of Flutamide Capsules (Schering’s Eulexin for angioplasty). 09/19/01- Launch of Enalapril (Merck’s Vaseretic for hypertension). August 2001 08/15/01- Offering of $300 million in convertible debentures due 2021. As of 8/14/01, Teva ADRs on the NASDQ closed at $67.05. The conversion price of U.S. $85 reflects a 28% relative premium. 08/15/01- According to its conference call, Teva revised its EPS expectation for the second half of 2001 to $1.15. According to Multex Global Estimates, Wall Street analysts on average were expecting EPS of $1.00 for the same period. Company sites Nambumetone launch and higher than expected Copaxone sales as major factors in their revision. 8/14/01- Teva wins lawsuit for Nabumetone (Glaxo’s Relafen). As the first applicant to challenge the listed patent on this drug, Teva will obtain 180 days of market exclusivity. 08/08/01- Tentative approval of Buspirone (Bristol’s Buspar for anxiety). 08/07/01- 15 European countries approve Copaxone for relapsing- remitting multiple sclerosis. European launch is expected in the last quarter of 2001 after the granting of national marketing authorizations. July 2001 07/19/01- FDA approves enhanced labeling for Copaxone following a large, multicenter, double- blind study versus placebo. 9 Teva Pharmaceutical October 8, 2001 Yale School of Management June 2001 06/27/01- Signs agreement with IMPAX Pharma granting exclusive option rights to 12 IMPAX products. Terms include a $15 MM equity participation by Teva. Products represent $5.7 BB in annual U.S. branded sales. Seven of the products fall under Paragraph IV of the Hatch- Waxmann amendment concerning marketing exclusivity. 06/17/01- Approval of Lovastatin tables (Merck’s Mevacor for high cholesterol.) 06/03/01- Tentative approval of Fluoxetine (Lilly’s Prozac for depression). However, another company may be eligible for Paragraph IV exclusivity. May 2001 05/31/01- Launches Famotidine 10mg (Merck’s Pepcid AC for heartburn). Paragraph IV exclusivity granted. April 2001 04/19/01- Tentative approval of Lisinopril (Merck’s Prinzide for hypertension). 04/17/01- Launches Famotidine 20mg and 40mg (Merck’s Pepcid for ulcers). 04/06/01- Bayer suit against Teva’s generic Adalatt dismissed in federal court. February 2001 02/07/01- Launches Nifedipine (Pfizer’s Procardia for angina). 10 Teva Pharmaceutical October 8, 2001 Yale School of Management Valuation Model DCF Analysis Assumptions Risk-free rate (rf) (10-year T-bond yield) Average historical risk premium Unlevered industry beta (bu) Tax rate (t) Beta of debt (bd) 4.49% 6.50% 1.02 22.00% 0.62 (Yahoo! Finance) (Ibbotson Associates) (www.stern.nyu.edu/~adamodar) (Calculated from company data) (rd - rf) / risk premium Cost of debt (rd) Debt/capital ratio Beta of equity (be) Cost of equity Equity/capital ratio WACC Long-term growth rate for strong growth model for moderate growth model for slow growth model Average number of outstanding shares 8.50% 19.00% 1.08 11.51% 81.00% 10.58% (Calculated from company data) (Calculated from company data) bu + (1-t)(bu - bd)*(Debt/capital) (Derived from CAPM model) (Calculated from company data) 4.00% 4.00% 3.00% 145MM (Assumed) (Assumed) (Assumed) (Assumed) 2001E 2002E 2003E 2004E 2005E 2006E 2007E 2008E 2009E 2010E 2011E 25.00% 24.00% $14,025.28 MM $1,072.70 MM $12,952.58 MM $89.33 23.00% 21.00% 19.00% 17.00% 15.00% 12.50% 10.00% 7.50% 4.00% 22.00% 21.00% $12,119.41 MM $1,072.70 MM $11,046.71 MM $76.18 20.00% 18.50% 17.00% 15.50% 14.00% 12.00% 10.00% 8.00% 4.00% 17.00% 15.50% 14.00% 12.50% 11.00% 5.00% 3.00% Strong Growth Model Growth Rate Enterprise Value Market Value of debt at September 2001 Value of Equity Value per share Moderate Growth Model Growth Rate Enterprise Value Market Value of debt at September 2001 Value of Equity Value per share Slow Growth Model Growth Rate Enterprise Value Market Value of debt at September 2001 Value of Equity Value per share Fair value per share 19.00% 18.00% $8,369.67 MM $1,072.70 MM $7,296.97 MM $50.32 $78.90 11 9.00% 7.00% Teva Pharmaceutical October 8, 2001 Yale School of Management Comparable Companies Analysis Selected Comparable Companies Mkt cap. ($ billion) Mylan Laboratories Watson Pharmaceuticals Average of comparable companies Teva Pharmaceuticals 4.42 6.08 Price/sales Price/book 4.81 5.86 5.34 3.73 3.59 3.66 Sales/Share Book/Share LTM Value per share 2001E Value per share 13.26 $70.76 15.56 $83.04 8.74 $31.97 11.15 $40.80 Value Range $31.97 ---- $83.04 Source: www.hoovers.com Definition: Price/Sales Ratio - Equals the last closing stock price divided by the LTM revenue per share. Price/Book Ratio - Equals the last closing stock price divided by common stock equity per share from the most recent balance sheet. Price/Earnings Multiples Teva Current price/Current earnings Future price/Current earnings Current price/Future earnings Future price/Future earnings Mylan 39.61 56.06 38.44 46.76 27.11 N/A N/A N/A Watson 136.07 N/A N/A N/A Source: www.hoovers.com Definition: Current price/share - equals the last closing stock price. Future price/share - $78.9 as per DCF analysis. Current earnings/share - equals LTM diluted earnings per share from total operations. Future earnings/share - equals 2001E earnings per share as per projected annual income statement. 12 Industry 91.03 N/A N/A N/A Teva Pharmaceutical October 8, 2001 Yale School of Management Appendix Appendix A Company Ratios Teva One Yr Profit Margin (Net Income/ Sales) X Sales Turnover (Sales/ Assets) Return on Assets X Leverage (Assets/ SE) Return on Equity X Plowback Ratio Sustainable Growth Rate Sales Growth Rate Earnings Growth Rate Return on Investment EPS P/E P/S P/B MRQ Watson One Yr 5 Yr Av Mylan 5Yr Av One Yr 5 Yr Av 11% 75% 9% 228% 20% 87% 17% 8% 83% 7% 226% 15% 87% 13% 6% 42% 2% 157% 4% 100% 4% 25% 57% 14% 130% 18% 100% 18% 18% 65% 12% 128% 15% 88% 13% 14% 65% 9% 115% 11% 88% 9% 33% 97% 12% 17% 14% 11% 40% -85% 3% 33% 24% 16% 18% 273% 14% 17% -19% 10% 1.15 37.45 4.24 6.39 1.68 107.7 5.59 3.44 Industry One Yr Sector 5Yr Av One Yr N/A 1% N/A 21% 4% 0% 225% 1637% 8% 5% 99% 99% 8% 5% 22% 21% 5% 32% 22% 3% 5 Yr Av 14% 95% 13% 183% 24% 73% 18% 12% 92% 11% 228% 25% 73% 18% 13% 27% 17% 16% 14% 17% 0.3 25.05 4.48 3.45 Source: TTM FY00 Busniess Browser Appendix B Leading Global Generic Manufacturers Mylan Teva Geneva Watson Schein Apothecon Zenith Abbott Prods Greenstone Others Generic Market Share Overall Prescription 1999 2000E 1999 2000E 11.2% 10.8% 6.7% 6.4% 5.9% 6.1% 4.8% 3.4% 2.9% 2.8% 39.0% 100.0% Source: IMS and UBS Warburg LLC estimates 13 11.8% 11.9% 7.2% 6.9% 6.1% 5.4% 5.1% 3.6% 2.9% 2.6% 36.5% 100.0% 4.8% 4.6% 2.9% 2.7% 2.5% 2.6% 2.0% 1.4% 1.2% 1.2% 74.1% 100.0% 5.0% 5.1% 3.1% 2.9% 2.6% 2.3% 2.2% 1.5% 1.2% 1.1% 73.0% 100.0% Teva Pharmaceuticals October 8, 2001 Yale School of Management Appendix C Sales for RR- MS Drugs (US$ million) United States Copaxone Total 1999 341 1,544 2000E 349 1,601 2001E 363 1,657 Copaxone Total 1999 96 1,605 2000E 117 1,713 2001E 145 1,872 Outside US Source: Investext Report # 2515028 Appendix D ANDA Approvals By Manufacturer 1997-2001 1997 1998 1999 2000 YTD (2) 2001 14 8 8 13 4 4 3 5 7 5 71 7 4 8 16 8 6 5 6 6 3 69 6 7 2 22 6 1 4 4 3 2 57 18 11 8 15 0 6 7 3 8 2 78 1 2 5 3 0 3 0 0 0 1 14 Teva IVAX Watson (3) Mylan Schein Barr Labs Taro Alpharma Abbott Laboratories Geneva Subtotal ANDA Pending Teva Ivax Watson Mylan Barr ANDAs Est. No. Of Est. No. Of Pending '01 Filings '01 Launches 49 38 20 24 18 Source: US FDA and SG Cowen Estimates 14 15 30 31 18 15 8-12 8-10 8-10 8-12 8-12 Teva Pharmaceuticals October 8, 2001 Yale School of Management Appendix E Generics Exposure Branded Drugs Off or Coming Off Patent Patent Expiration Brand Generic Function Patent Holder 1999 Global Sales (US$MM) 1999 Dec-99 Humulin human insulin diabetes Eli Lily 1,087 2000 Feb-00 Feb-00 Mar-00 May-00 May-00 Jul-00 Feb-00 Oct-00 Oct-00 Nov-00 Hytin Vasotec Glucophage Ceftin Buspar Neurotin Taxol Pepcid Cardura ProcardiaXt terazosin entapril metformin ceturoxime buspirone gabapantin paclitaxel famotidine doxazosin plfedpine hypertension hypertension diabetes infection anxiety epilepsy cancer gastrointestinal cancer hypertension Abbott Merck BMS Glaxo BMS Pfizer BMS Merck Pfizer Pfizer 570 2,805 1,317 680 605 918 1,481 910 794 521 10,601 Subtotal 2001 Feb-01 Mar-01 Jun-01 Aug-01 Dec-01 Dec-01 Prozac Prilosec Mevacor Accutane Prinivil Zestril fluoxetine bmeprazole lovastatin isotretinoin lisinopril lisinopril hypercholestrolemia acne hypertension hypertension 2002 Dec-02 Dec-02 April-02 Dec-02 Augmentin Infron A alpha Axid Relaten amoxicillin interferon Plougn nizatidine nabumetone infection hepatitis-C gastrointestinal arthritis 2003 Feb-03 Nov-03 Nov-03 Nov-03 Dec-03 2004 Jan-04 April-04 April-04 June-04 July-04 Aug-04 Oct-04 Dec-04 2005 May-05 June-05 July-05 Aug-05 Sept-05 Oct-05 Oct-05 Dec-05 Dec-05 Dec-05 Dec-06 Singulair Flovent Flonase Cipro Engerix-B Diflucan Paraplatin Claritin Xencial Lamisil Welbutnn Lupron Lovenox Biaxin Zotran Prevacid Aredia Zoladex Combivl Zithromax Pravachol Zocor Zoloft Paxil montelukast fluticasone fluticasone ciprofloxacin hepatitis B vaccine fluconazole carboplatin loratadine orlistat terbinafine buproprion leuprolide epoxapatin clarithromycin ondansetron lansoprazole pamidronate gosereline lamiudine azithromycin pravastatin simvastatin sertraline paroxetine depression asthma asthma allergy infection Glaxohepatitis B infection cancer obesity tinea pedis cancer deepveinthromposis infection nausea ulcer hypercalcemis endometriosis HIV infection hypercholesterolemia hypercholesterolemia depression depression Source: Orange Book and UBS Warburg LLC estimates 15 El Lilly AstraZenecagastrointestina9 Merck Rache Merck AstraZenecathypertension Subtotal Glaxo Scnering Eli Lilly Glaxo 2,613 600 705 815 1,220 5,953 Subtotal 1,819 850 350 267 3,286 Subtotal 500 1,079 593 1,625 540 4,337 Merck Glaxo Glaxo Bayer SmithKline Pfizer BMS Schering Plough Roche Novartis Glaxo Tap Aventis 1,002 500 499 700 Subtotal 730 760 4,191 Subtotal Grand Total 1,275 674 1,900 588 686 736 1,333 704 4,495 2,034 2,109 16,534 45,989 Abbott Glaxo Tap Novartis AstraZeneca Glaxo Pfizer BMS Merck Pfizer Glaxo Important Disclaimer Please read this document before reading this report. This report has been written by MBA students at Yale's School of Management in partial fulfillment of their course requirements. The report is a student and not a professional report. It is intended solely to serve as an example of student work at Yale’s School of Management. It is not intended as investment advice. It is based on publicly available information and may not be complete analyses of all relevant data. If you use this report for any purpose, you do so at your own risk. YALE UNIVERSITY, YALE SCHOOL OF MANAGEMENT, AND YALE UNIVERSITY’S OFFICERS, FELLOWS, FACULTY, STAFF, AND STUDENTS MAKE NO REPRESENTATIONS OR WARRANTIES, EXPRESS OR IMPLIED, ABOUT THE ACCURACY OR SUITABILITY FOR ANY USE OF THESE REPORTS, AND EXPRESSLY DISCLAIM RESPONSIBIITY FOR ANY LOSS OR DAMAGE, DIRECT OR INDIRECT, CAUSED BY USE OF OR RELIANCE ON THESE REPORTS. 16
