AP Statistics Quiz A – Chapter 26
Name
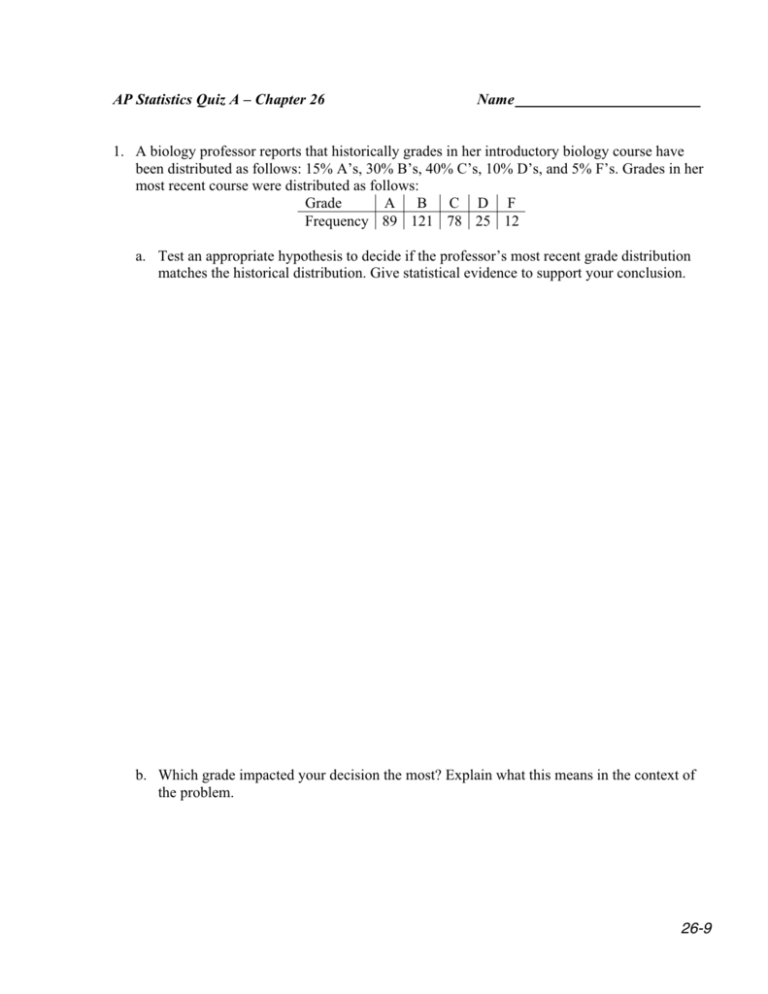
1. A biology professor reports that historically grades in her introductory biology course have
been distributed as follows: 15% A’s, 30% B’s, 40% C’s, 10% D’s, and 5% F’s. Grades in her
most recent course were distributed as follows:
Grade
A B C D F
Frequency 89 121 78 25 12
a. Test an appropriate hypothesis to decide if the professor’s most recent grade distribution
matches the historical distribution. Give statistical evidence to support your conclusion.
b. Which grade impacted your decision the most? Explain what this means in the context of
the problem.
26-9
2. As part of a survey, students in a large statistics class were asked whether or not they ate
breakfast that morning. The data appears in the following table:
Breakfast
Yes No Total
Male
66 66 132
Sex
Female 125 74 199
Total 191 140 331
Is there evidence that eating breakfast is independent of the student’s sex? Test an appropriate
hypothesis. Give statistical evidence to support your conclusion.
26-10
AP Statistics Quiz A – Chapter 26 – Key
1. A biology professor reports that historically grades in her introductory biology course have
been distributed as follows: 15% A’s, 30% B’s, 40% C’s, 10% D’s, and 5% F’s. Grades in her
most recent course were distributed as follows:
Grade
A B C D F
Frequency 89 121 78 25 12
a. Test an appropriate hypothesis to decide if the professor’s most recent grade distribution
matches the historical distribution. Give statistical evidence to support your conclusion.
We want to know if the most recent grade distribution matches the historical grade
distribution.
H 0 : The most recent grade distribution matches the historical grade distribution.
H A : The most recent grade distribution differs from the historical grade distribution.
Conditions:
*Counted data: We have the counts of the number of students who earned each grade.
*Randomization: We have a convenience sample of students, but no reason to suspect bias.
*Expected cell frequency: There are a total of 325 students. The smallest percentage of expected grades
are F’s, and we expect 325(0.05) = 16.25. Since the smallest expected count exceeds 5, all expected
counts will exceed 5, so the condition is satisfied.
Under these conditions, the sampling distribution of the test statistic is χ 2 with 5 – 1 = 4 degrees of
freedom, and we will perform a chi-square goodness-of-fit test.
Grade
Observed Frequency
Expected Frequency
A
89
48.75
33.232
χ 2 component
2
χ =∑
(Obs − Exp )
Exp
B
121
97.5
5.6641
C
78
130
20.8
D
25
32.5
1.7308
F
12
16.25
1.1115
2
2
2
2
2
(89 − 48.75) + (121 − 97.5) + (78 − 130) + ( 25 − 32.5) + (12 − 16.225)
=
48.75
= 62.538
97.5
130
32.5
2
16.25
The P-value is the area in the upper tail of the χ 2 model with 4 degrees of freedom above the computed
χ 2 value. P-value = P χ 2 > 62.538 = 8.5 × 10⁻¹³
(
)
The P-value is very small, so we reject the null hypothesis. There is strong evidence that the most recent
grade distribution differs from the historical grade distribution.
b. Which grade impacted your decision the most? Explain what this means in the context of
the problem.
The χ 2 component for A’s is the largest, 33.232:. More students earned A’s than we would have
expected based on the historical grade distribution.
26-11
2. As part of a survey, students in a large statistics class were asked whether or not they ate
breakfast that morning. The data appears in the following table:
Breakfast
Yes No Total
Male
66 66 132
Sex
Female 125 74 199
Total 191 140 331
Does it appear eating breakfast is independent of the student’s sex? Test an appropriate
hypothesis. Give statistical evidence to support your conclusion.
We want to know whether the categorical variables “eating breakfast” and “student’s sex” are statistically
independent.
H 0 : Eating breakfast and student’s sex are independent.
H A : There is an association between eating breakfast and student’s sex.
Conditions:
*Counted data: We have the counts of individuals in categories of two categorical variables.
*Randomization: We have a convenience sample of students, but no reason to suspect bias.
*Expected cell frequency: The expected values (shown in parenthesis in the table) are all greater than 5, so
the condition is satisfied.
Under these conditions, the sampling distribution of the test statistic is χ 2 with
( r − 1) ( c − 1) = ( 2 − 1) ( 2 − 1) = 1 degree of freedom, and we will perform a chi-square test of independence.
Male
Female
Total
Sex
2
2
χ =∑
Breakfast
Yes
No
66 (76.169) 66 (55.831)
125 (114.83) 74 (84.169)
191
140
2
2
Total
132
199
331
2
(Obs − Exp ) = (66 − 76.169) + (66 − 55.8831) + (125 − 114.83) + (74 − 84.169)
Exp
76.169
The P-value is P χ 2 > 5.339 = 0.0209 .
(
55.831
114.83
84.169
2
= 5.339
)
The P-value of 0.0209 is pretty small, so we reject the null hypothesis. There is evidence of an association
between the student’s sex and whether or not breakfast is eaten. It appears that females may be more likely to
eat breakfast.
26-12


