Understanding Your Trade Area:
Implications for Retail Analysis
Defining a town’s trade area is an important first step
in developing a strong retail economy. It is the foundation of retail trade analysis, since it helps existing businesses identify ways to expand their markets.
This publication shows a few simple ways to determine the geographic size of a town's trade area.
Knowing the trade area lets decision makers do a market analysis of the local area, using important statistics
such as number of customers, potential sales, pull factors, and other measures of retail strength.
Defining the Trade Area
Whatever the reasons for existing retail sales, city
and county leaders can help local businesses improve
these trends. To determine how much retail sales might
increase, first define the trade area.
A trade area is the geographic region from which a
town draws most of its retail customers. Here are
some ways to define a trade area:
•
•
•
•
Study traffic flow
Use a retail gravity model
Use a zip code method
Use commuting data to define the trade area
boundaries
For the beginner economist, the commuting and
retail gravity approaches present the lesser challenges in
terms of application.
Traffic Flow
Traffic studies involve random canvassing of parking
lots at major locations in town at different times on different days and over several weeks. These locations
might include the downtown area, major shopping destinations such as shopping malls and centers, Wal-Mart
Super Center, Home Depot, Kroger, and other popular
establishments. You should monitor vehicle license
plates from different locations to get an overview of
vehicles from surrounding counties, record the findings, and compare them to regional commuting data.
Results from a traffic study will usually reveal the
major towns and counties that make up the local trade
area or market.
To determine the major communities in the local
market, rank the number of vehicles from various
counties in the region and select the top five or six
localities based on the highest frequency and/ or the
maximum percentage of license plates in the area.
Commuting
The time it takes local residents to commute to work
is another way to identify a community’s retail trade
area. Converting commuting time to work into spatial
distances or miles and plotting these data on a map
gives a picture of the geographic size of a community’s
trade area.
Reilly’s Law
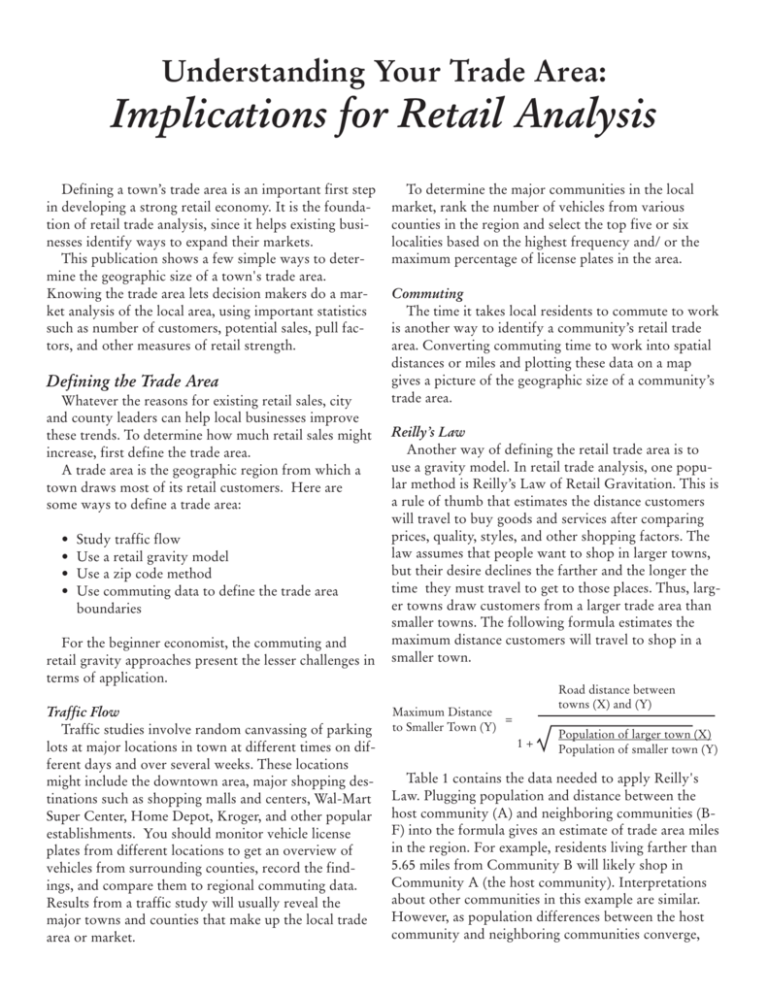
Another way of defining the retail trade area is to
use a gravity model. In retail trade analysis, one popular method is Reilly’s Law of Retail Gravitation. This is
a rule of thumb that estimates the distance customers
will travel to buy goods and services after comparing
prices, quality, styles, and other shopping factors. The
law assumes that people want to shop in larger towns,
but their desire declines the farther and the longer the
time they must travel to get to those places. Thus, larger towns draw customers from a larger trade area than
smaller towns. The following formula estimates the
maximum distance customers will travel to shop in a
smaller town.
Road distance between
towns (X) and (Y)
Maximum Distance
=
to Smaller Town (Y)
1+
Population of larger town (X)
Population of smaller town (Y)
Table 1 contains the data needed to apply Reilly's
Law. Plugging population and distance between the
host community (A) and neighboring communities (BF) into the formula gives an estimate of trade area miles
in the region. For example, residents living farther than
5.65 miles from Community B will likely shop in
Community A (the host community). Interpretations
about other communities in this example are similar.
However, as population differences between the host
community and neighboring communities converge,
the trade area distance increases. This suggests the retail
economies of these communities are similar, with no
clear shopping advantages between them.
Plotting the trade area distances on a map gives local
officials and merchants a picture of the community's
trade area.
In using this formula, there are a few assumptions
and cautions. First, the formula assumes the trade area
is circular and uses pi (π) to determine the number of
customers drawn from the population. Second, areas
with large populations and densities per square mile
can distort the actual situation in retail trade analysis.
Third, Reilly's Law is less accurate in calculating trade
miles when involving larger towns.
Population and Travel Distances in Community A's Trade Area
Distance
County
Total
Population
Community A
22,000
Community B
1,543
(from Community A
to County Seat)
27
Trade Area
Distance
Using Information
about Market Size
5.65
After defining the trade area, estimate the local sales
potential and compare that to actual sales in the area.
The following formula estimates potential retail sales.
Community C
23,799
23
11.73
Community D
2,145
27
6.42
Community E
7,169
33
11.99
Community F
8,489
17
6.51
Average
10,858
25.4
8.46
Trade Area
Population
Estimating Total Market Size
Identifying a trade area's physical boundaries lets
you estimate the total number of people in the market
size. The total market consists of populations in the
host community plus populations from surrounding
towns in the trade area. The following data and formula
provide estimates of other customers drawn to the area:
3.14 X (Average Retail Trade Miles)2 X
Average County Trade Population Density Per Square Mile
N
Example: (π is a constant = 3.14)
Average trade area
retail miles = 8.46
Number of extra customers drawn to
Community A = 11,563
W
6.42 miles
11.27 miles
Community D
Community C
Community A
Community B
5.65 miles
Total retail customer base = 33,563
(22,000 + 11,563)
S
Community A's
Per Capita Income
State Per Capita
Income
Comparing actual and potential sales lets you determine if a community has room for retail growth. The
difference between actual and potential sales is the
retail "leakage or gap" in the community. Compare
sales over several years to determine the long-term
health of retail sectors in the community. Some sectors
will represent opportunities for economic growth and
expansion, but others will point out areas of
economic need and stimulation.
Community F
6.51 miles
Community A's
population = 22,000
Average trade area
county population
density per square mile =
51.45
Potential Sales =
State Per
x Capita
x
Sales
Community E
11.99 miles
Information on actual sales
by cities and county is
available on the
Mississippi State Tax
Commission website
(www.mstc.state.ms.us/)
E
for selected years. Data
on population and
income for Mississippi
are available from the U.S.
Census Bureau.
Determining Retail Power
Trade Area Capture
Information about a community's trade area can help
officials assess the ability of local merchants to attract
and capture the retail business of people in the area.
The trade area capture (TAC) is an estimate of the
number of people who shop in the local area during a
certain period. The formula for calculating TAC is as
follows:
TAC =
Actual Retail Sales in Community A
State Per Capita Sales X
Community A's Per
Capita Income
State Per
Capita Income
TAC is the number of customer equivalents and not
the people sold to by retail merchants. For example, a
community of 9,000 and a TAC of 10,500 suggests purchases made by these customers are equivalent to selling to 10,500 people in the community. This simply
says that per capita retail expenditures among these
customers are higher than per capita expenditures
statewide.
Pull Factors
Determing the trade area is the first step in retail
analysis. By knowing the trade area, you can determine
the size and strength of local merchants in the market
using pull factors. Pull factors are ratios that estimate
the proportion of local sales that occurs in a town.
Here is the most common method of calculating pull
factors:
Pull Factor (PF) =
Trade Area Capture
City Population
You can also calculate pull factors for specific retail
sectors by using the following revised equation for the
sectors in question. The interpretations are the same.
PFit
=
LCit
LPt
SSit
SPt
Where: PF
LC
LP
SS
SP
i
t
=
=
=
=
=
=
=
Pull Factor
Local Sales
Local Population
State Sales
State Population
Retail Sector
Time Period
Pull factors are an easy way to determine retail leakage in the community. Subtracting one from the pull
factor gives a crude estimate of retail loss. If the product is positive, then the community is attracting customers from outside the immediate trade area. If the
product is negative, the community is losing customers
to neighboring towns. A value of zero suggests the
community is maintaining its customer base, neither
attracting nor losing customers to competing communities.
For more information, refer to these publications:
"Gap Analysis as a Tool for Community Economic
Development" by Suzetta D. Barta and Mike Woods.
Oklahoma Cooperative Extension Service, 1999.
Community Economic Analysis: A How-To Manual
by Ronald J Hustedde, Ron Shaffer, and Glen Pulver.
North Central Regional Center for Rural development.
Iowa State University. Ames Iowa, 1994.
"Potential for Retail Trades in Rural Communities"
by Jay Simon and Curtis Braschler. University of
Missouri Extension Service. Columbia, Missouri, 1987.
By Dr. Albert E. Myles, Extension Professor, Community Resource Development
Copyright 2003 by Mississippi State University. All rights reserved. This publication may be copied and distributed without alteration
for nonprofit educational purposes provided that credit is given to the Mississippi State University Extension Service.
Mississippi State University does not discriminate on the basis of race, color, religion, national origin, sex, age, disability, or veteran status.
Publication 2321
Extension Service of Mississippi State University, cooperating with U.S. Department of Agriculture. Published in furtherance of Acts of
Congress, May 8 and June 30, 1914. JOE H. MCGILBERRY, Director
( 500-07-03)


