Hooke's Law: Spring Constant Lab Manual
advertisement
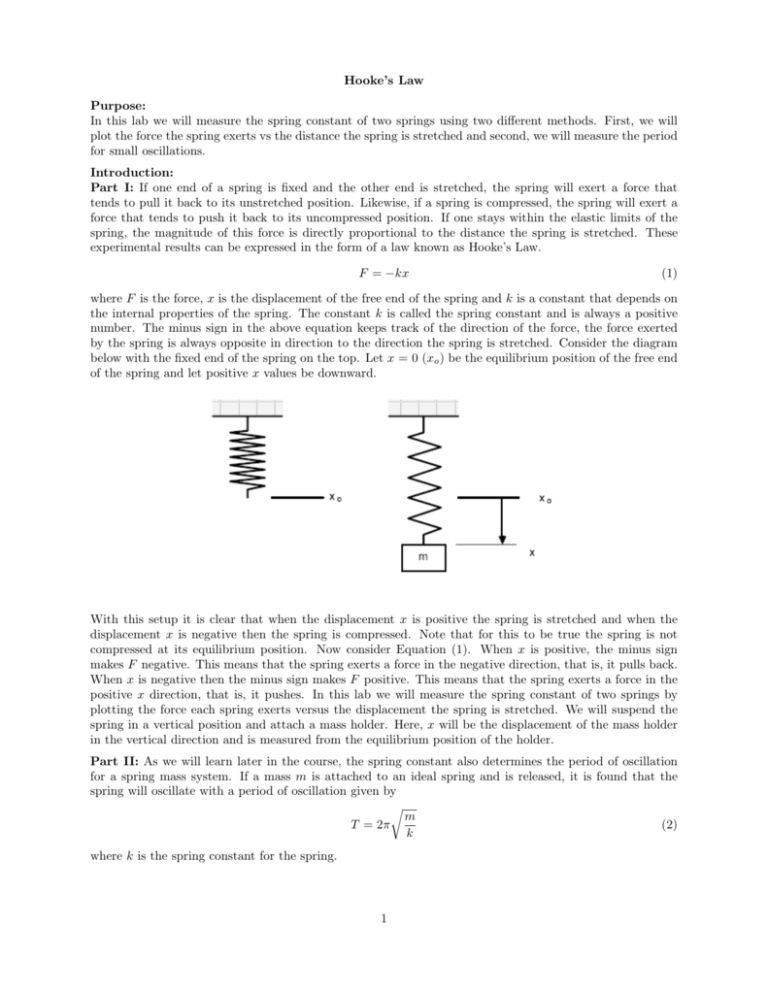
Objective: To determine the spring constant of a spiral spring by Hooke’s law and by its period of oscillatory motion in response to a weight. Hooke’s Law Apparatus: A spiral spring, a set of weights, a weight hanger, a balance, a stop watch, and a twometer stick. Purpose: In this lab we will measure the spring constant of two springs using two different methods. First, we will plot the force the spring exerts vs the distance the spring is stretched and second, we will measure the period Theory: for small oscillations. The restoring force, F, of a stretched spring is proportional to its elongation, x, if the Introduction: deformation is not too great. This relationship for elastic behavior is known as Hooke's law and is Part I: If one described end of a spring is fixed and the other end is stretched, the spring will exert a force that by tends to pull it back to its unstretched position. if a spring is compressed, F = Likewise, -kx (eq. 1), the spring will exert a force that tends to push it back to its uncompressed position. If one stays within the elastic limits of the where kofis this the constant of proportionality called the spring constant. The is spring’s restoring force acts spring, the magnitude force is directly proportional to the distance the spring stretched. These in the opposite direction to its elongation, denoted by the negative sign. For a system such as shown in experimental results can be expressed in the form of a law known as Hooke’s Law. figure 1, the spring's elongation, x – x0, is dependent upon the spring constant, k, and the weight of a F If =the −kx mass, mg, that hangs on the spring. system of forces is in equilibrium (i.e., it has no (1) relative acceleration), then the sum of the forces down (the weight) is equal and opposite to the sum where F is the force, x is the displacement of the free end of the spring and k is a constant that depends onof the forces acting the spring), or constant and is always a positive the internal properties of theupward spring. (the Therestoring constantforce k is of called the spring number. The minus sign in the above equation keeps track of the direction of the force, the force exerted m gthe = kdirection (x – x0) the spring is stretched. (eq. 2). Consider the diagram by the spring is always opposite in direction to below with the fixed end of the spring on the top. Let x = 0 (xo ) be the equilibrium position of the free end of the spring and let positive x values be downward. With this setupComparing it is clear equation that when the displacement x isequation positiveofthe spring is stretched thesee that if 2 with the form for the a straight line (y = mxand + b),when we can displacement x we is negative then produced the springbyis different compressed. Note that this toof bethe true the spring from is not plot the force masses (mg) as aforfunction displacement compressed at its equilibrium Now consider Equation When is positive, the minus equilibrium (x-xposition. should be linear and the(1). slope of thex line will be equal to the sign spring 0), the data makes F negative. This means thatstandard the spring exerts a force in the negative direction, that is, it pulls back. constant, k, whose metric units are N/m. When x is negative then minusissign makes F positive. means that the spring exerts a force in the If the the mass pulled so that the springThis is stretched beyond its equilibrium (resting) position, the positive x direction, thatforce is, itofpushes. In this weanwill measure the spring constant of two springs byof the restoring the spring will lab cause acceleration back toward the equilibrium position plotting the force each spring exerts versus the displacement the spring is stretched. We will suspend the spring in a vertical position and attach a mass holder. Here, x will be the displacement of the mass holder in the vertical direction and is measured from the equilibrium position of the holder. 66 Part II: As we will learn later in the course, the spring constant also determines the period of oscillation for a spring mass system. If a mass m is attached to an ideal spring and is released, it is found that the spring will oscillate with a period of oscillation given by r m T = 2π (2) k where k is the spring constant for the spring. 1 Hooke’s Law Laboratory Procedure: Remember to do all work in your Lab Notebook. This means copy tables into your notebook. Use correct heading and write in pen. Part I - Taking Direct Measurements 1. Begin by hanging one end of a spring from the ring stand. Hang a mass holder from the other end of the Aim: spring. The spring mustRobert be stretched untilone theofadjacent turns of the spring arebetween no longer Hooke was the first to notice a relationship thecompressed force applied to an against each other in order for the elongation of the spring to vary linearly with the applied force, Law in which elastic object and its extension. This lab is designed to test and verify Hooke’s accordance with Hooke’sstates Law.that For“the theextension brass spring, mass hangeris is sufficient to do this. Forapplied the force so of an the elastic material directly proportional to the steel spring, add 500 g mass to the theelastic mass hanger. long as limit is not exceeded”. Diagram: Apparatus: Clamp and stand Spring Metre Rule Mass holder Slotted masses Force 2. Hold the meter stick alongside the spring and measure the height of the bottom of the mass holder. Method:position (x = 0). Record this position in your lab notebook. This position is the equilibrium Set up the apparatus as shown in the diagram above. Apply various forces to the spring and 3. Add masses in increments of 20.0 g for the (remember brass spring and g for =the steel spring. record its extension that the100.0 extension final length í original length). 4. Record the displacementData fromCollection: the equilibrium position, x. x the Record pairs of data forthe force and extension in a suitable table. 5. Record the uncertainty in displacement from equilibrium position, δx, based on the precision x Your results table and the presentation of data should include any uncertainties associated of the meterstick. with the apparatus that you have used. 6. Calculate the fractional uncertainty (δx/x) for this measurement and record this in your data table. Data Processing and presentation: 7. Record the mass, m that was required to stretch the spring from the equilibrium position, i.e., the x Use your results to plot a suitable graph which will allow you to accurately calculate the mass added beyond that in step one. spring constant, k, for your spring. x in SLyour & HL, include bars subtracting for each datasmall point.amounts of mass to see 8. Determine the uncertainty masses δmuncertainty by adding and calculate the uncertainty in the yoursystem final value for the spring constant by drawing how much can be addedxor HL, subtracted while still keeping in equilibrium. maximum and minimum slope on your graph. 9. Calculate the force (in Newtons) from your mass values. Note that there are 1000 grams kg , and that g = 9.81 sm2 . Conclusion and Evaluation: x Your evaluation should of include a final value for the spring constant of your spring 10. Repeat steps 3-9 for a total of ten measurements xi and mi , the distance and corresponding mass together with an estimate of the uncertainty. measured from the equilibrium point, for one spring. x Does your graph verify Hooke’s Law? 11. Repeat steps 1-10 for the spring. x other Evaluate the procedure and result including limitations, weaknesses or errors. 12. Draw a full-page graph of the force vs. displacement. The force, F , is to be plotted along the vertical axis and displacement, x, is to be plotted along the horizontal axis. Include the data for both springs Mike Dickinson on the same graph or separate graphs labeling them steel or brass. 13. Fit a line to your data and determine the slopes of your lines. The slope corresponds to the spring constant, k of the spring. 2 Hooke's Law Part II - Taking Indirect Measurements 1. Hang a small known mass, mk from the brass spring (including the mass of the holder, mh ). 2. Measure the period of small oscillations of the system by measuring the time, t, it takes for the spring to make 20 oscillations (N=20). 3. Record the time and calculate the period, T , (T = t/N). As a check for blunders (miscounting, for example), repeat twice more and average. 4. Determine δT by first determining the uncertainty in your reaction time. Find your reaction time by starting and stopping the stopwatch quickly, then divide that time by your twenty revolutions. δT = reaction time N 5. Determine the fractional uncertainty (δT /T ) for this measurement and record this in your data table. 6. As it turns out, the mass of the spring itself does affect the motion of the system, thus we must add 13 the mass of the spring to account for this. In order to calculate the mass, m, used in equation 2 then, add 31 the mass of the spring (ms ), plus the mass on the hanger (mk ), plus the mass of the hanger (mh ). 1 m= ∗ ms + mk + mh 3 7. Determine δm from the precision of the electronic balance. 8. Determine the fractional uncertainty (δm/m) for this measurement and record this in your data table. 9. Repeat steps 1-8 with the steel spring but use more mass (1Kg) on the mass holder. 10. Calculate the spring constant, k, for both springs in part II using the equation for the period of oscillation for a spring mass system, equation 2. Part III - Determining Uncertainties in Your Final Values In the results section of your notebook, state the results of both parts of your experiment in the form k±δk. Note, δk in part I should be equal to the largest fractional uncertainty from your values of mass or displacement fractional uncertainties multiplied by your value of k from Part I. For Part II, δk should be equal to the largest fractional uncertainty from your values of period or mass fractional uncertainties multiplied by your value of k from Part II. For example, δm δx , δk = k ∗ max m x You should also address the following question: 1. Do your results for k in the two parts for both springs agree within their uncertainties? Be sure to clearly state the quantitative values you are comparing. If there are any large discrepancies, quantitatively comment on their possible origin. 3
