Stopping Distance One aspect of safe driving involves the ability to
advertisement

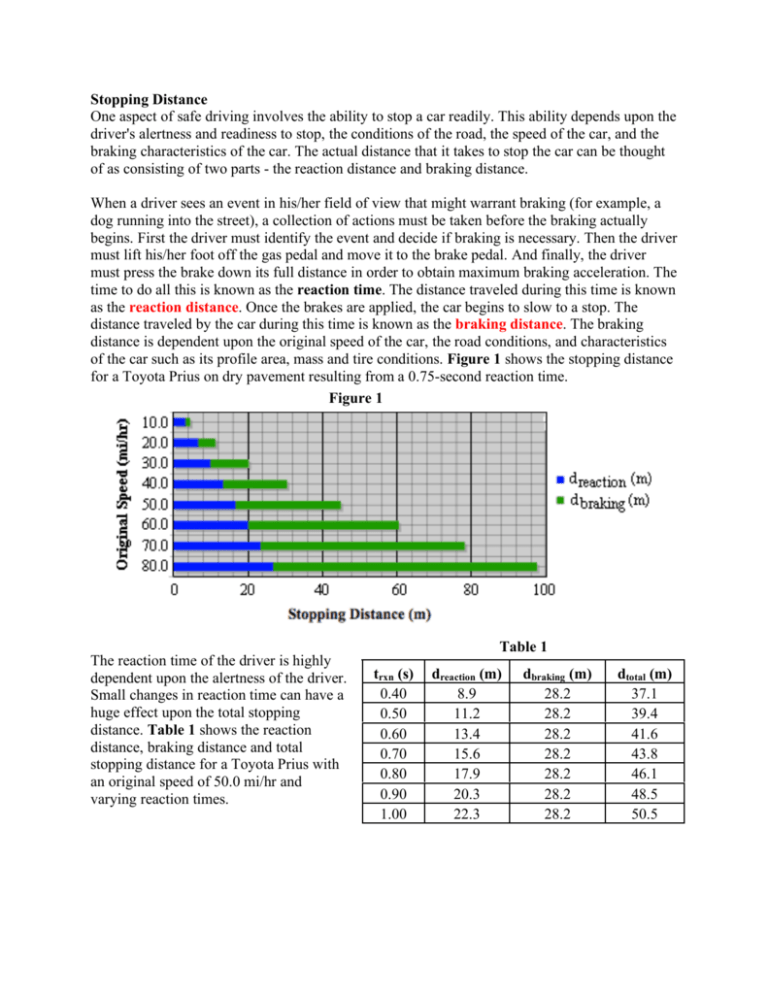
Stopping Distance One aspect of safe driving involves the ability to stop a car readily. This ability depends upon the driver's alertness and readiness to stop, the conditions of the road, the speed of the car, and the braking characteristics of the car. The actual distance that it takes to stop the car can be thought of as consisting of two parts - the reaction distance and braking distance. When a driver sees an event in his/her field of view that might warrant braking (for example, a dog running into the street), a collection of actions must be taken before the braking actually begins. First the driver must identify the event and decide if braking is necessary. Then the driver must lift his/her foot off the gas pedal and move it to the brake pedal. And finally, the driver must press the brake down its full distance in order to obtain maximum braking acceleration. The time to do all this is known as the reaction time. The distance traveled during this time is known as the reaction distance. Once the brakes are applied, the car begins to slow to a stop. The distance traveled by the car during this time is known as the braking distance. The braking distance is dependent upon the original speed of the car, the road conditions, and characteristics of the car such as its profile area, mass and tire conditions. Figure 1 shows the stopping distance for a Toyota Prius on dry pavement resulting from a 0.75-second reaction time. Figure 1 The reaction time of the driver is highly dependent upon the alertness of the driver. Small changes in reaction time can have a huge effect upon the total stopping distance. Table 1 shows the reaction distance, braking distance and total stopping distance for a Toyota Prius with an original speed of 50.0 mi/hr and varying reaction times. Table 1 trxn (s) 0.40 0.50 0.60 0.70 0.80 0.90 1.00 dreaction (m) 8.9 11.2 13.4 15.6 17.9 20.3 22.3 dbraking (m) 28.2 28.2 28.2 28.2 28.2 28.2 28.2 dtotal (m) 37.1 39.4 41.6 43.8 46.1 48.5 50.5 Questions: 1. Based on Figure 1, what effect does the doubling of the speed of a car have upon the braking distance? a. The braking distance is doubled. b. The braking distance is one-half the value. c. The braking distance is not affected by a doubling of speed. d. The braking distance is increased by more than a factor of two. 2. What is the reaction distance of a Toyota Prius moving at 60.0 mi/hr on dry pavement and driven by a driver with a 0.75-second reaction time? a. 16.8 meters b. 20.0 meters c. 40.0 meters d. 60.0 meters 3. Based on Figure 1, at what car speed does the reaction distance of a car equal the braking distance of a car? a. 20.0 mi/hr b. 30.0 mi/hr c. 40.0 mi/hr d. 60.0 mi/hr 4. A student is texting while driving a Toyota Prius at 50.0 mi/hr on dry pavement. As a result, the reaction time is 1.5 seconds. Use the data of Table 1 to predict the total stopping distance of the student’s car. a. Approximately 33.5 meters b. Approximately 45.0 meters c. Approximately 50.5 meters d. Approximately 61.7 meters 5. Which of the following combinations of reaction time and car speed would lead to the greatest stopping distance? a. Reaction time = 0.90 seconds; car speed = 30 mi/hr. b. Reaction time = 0.75 seconds; car speed = 40 mi/hr. c. Reaction time = 0.90 seconds; car speed = 50 mi/hr. d. Reaction time = 0.70 seconds; car speed = 80 mi/hr. Answers and Explanations: 1. Answer: D Explanation: Some numerical values must be estimated in order to answer this question. Estimates should be made of the braking distance (the lighter of the two bars in Figure 1) for any two speeds that have a 2:1 ratio. Estimating the braking distance requires that one starts the measurement from where the reaction distance ends. For instance, the braking distance at 20.0 mi/hr is approximately 5 meters (from 6 meters to 11 meters). The braking distance at twice this speed - 40.0 mi/hr is 17 meters (from 13 meters to 30 meters). This doubling of the speed from 20.0 mi/hr to 40.0 mi/hr results in more than a doubling of the reaction distance. 2. Answer: B Explanation: Figure 1 data is based on a Toyota Prius driven by a person with a 0.75 second reaction time. The reaction distance at 60.0 mi/hr can be read off the bar chart. Reaction distance is the darker bar. Its length is approximately 20 meters at this speed. 3. Answer: B Explanation: Figure 1 represents the reaction distance by the darker bar and the stopping distance y the lighter bar. For most listed speeds, the two bar lengths are not equal. But at 30.0 mi/hr, the darker bar and the lighter bar have the same length - 10 meters each. 4. Answer: D Explanation: The total stopping distance is the sum of the reaction distance and the braking distance. These values are listed in Table 1 for various reaction times. The maximum reaction time listed in the table is 1.00 seconds. Since this question pertains to a reaction time of 1.5 seconds, one will have to extrapolate to determine the answer. Extrapolation involves using an observed trend to estimate the value of a quantity that falls outside the range of stated values. The trend in the dreaction values is that it increases by about 4.5 meters (estimated average) for every 0.20 second increase in trxn value. So at 1.5 seconds, the dreaction value would be approximately 13.5 m (three times 4.5 m) greater than the 20.3 m value at 0.90 seconds. This would yield an estimate of 33.8 m for dreaction. The trend in dbraking values is that it remains constant at 28.2 m for a 50.0 mi/hr Toyota Prius. Summing the dreaction and the dbraking values leads to an estimate of 62 m for the total stopping distance. The closest answer to the estimated 62 meters is the 61.7 m of choice D. 5. Answer: D Explanation: What is observed in Figure 1 is that braking distance increases with increasing speed. In fact, a doubling of the speed more than doubles the braking distance. One also observes that an increase in speed causes an increase in reaction distance. This effect is not as pronounced as the effect of car speed on braking distance for a doubling of car speed doubles the reaction distance. In Table 1, one observes that an increase in car speed and in reaction time each increase the reaction distance. A doubling of reaction time will double the reaction distance. Finally one learns that braking distances tend to be greater than reaction distances and thus the greater contributor to the total stopping distance. As such, one would reason that higher speeds would be the more dominant factor in answering this question. Choice D has the highest speed of all listed speeds and thus becomes an immediate first choice. Of course the question is do any of the lower speed vehicles compensate for its shortage in braking distance by a larger reaction distance. Choice C is the only one that needs to be considered since it has both the largest reaction time and the largest speed of the remaining choices. The 50 mi/hr speed of choice C makes its stopping distance findable in Table 1. The extra 0.20 seconds in reaction time would give the choice C car an approximately 5 meter advantage … and that is only if the choice C car had the same speed (and it doesn’t). This miniscule 5 meters is not nearly enough to compensate for the larger advantage that the choice D car has in terms of its braking distance. Choice D clearly has a larger stopping distance.


