Using Willow and Wheat Straw Biochar as a Soil
Amendment in the Reclamation of Saline Soils
1
Weiseth
1
Schoenau
Blake N.
and Jeff J.
1Dept. of Soil Sci.,University of Saskatchewan
Biochar is a substance that is produced by
pyrolysis of feedstock under oxygen limited
conditions at temperatures between 350 and
600°C (Sohi et al., 2010). Several physical
properties of biochar support its potential use as a
soil amendment in the reclamation of salt-affected
soils. Biochar is stable, inert, and possesses a
high surface area to adsorb nutrients due to its
small particle size (Jiang et al., 2012).
Objectives
on
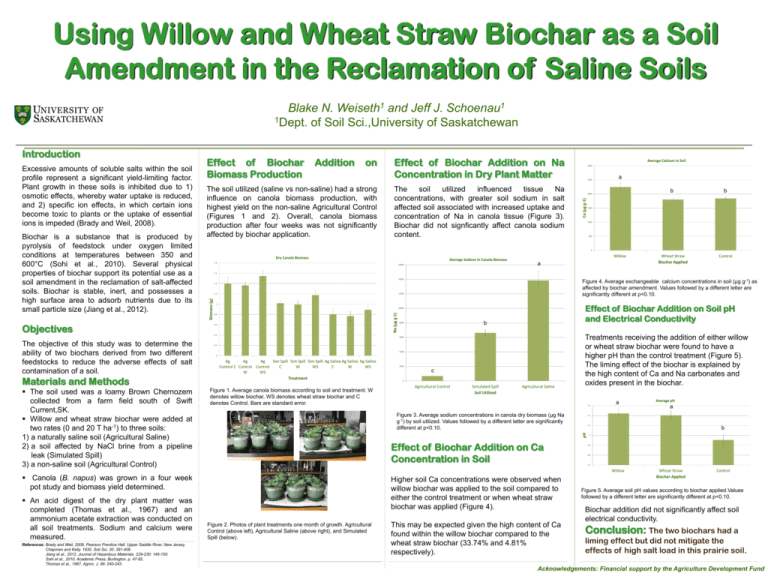
The soil utilized (saline vs non-saline) had a strong
influence on canola biomass production, with
highest yield on the non-saline Agricultural Control
(Figures 1 and 2). Overall, canola biomass
production after four weeks was not significantly
affected by biochar application.
Effect of Biochar Addition on Na
Concentration in Dry Plant Matter
The
soil
utilized
influenced
tissue
Na
concentrations, with greater soil sodium in salt
affected soil associated with increased uptake and
concentration of Na in canola tissue (Figure 3).
Biochar did not signficantly affect canola sodium
content.
The soil used was a loamy Brown Chernozem
collected from a farm field south of Swift
Current,SK.
Willow and wheat straw biochar were added at
two rates (0 and 20 T ha-1) to three soils:
1) a naturally saline soil (Agricultural Saline)
2) a soil affected by NaCl brine from a pipeline
leak (Simulated Spill)
3) a non-saline soil (Agricultural Control)
2500
a
2000
Dry Canola Biomass
Average Sodium in Canola Biomass
1.8
16000
Wheat Straw
Biochar Applied
Control
500
Willow
a
1.6
14000
Figure 4. Average exchangeable calcium concentrations in soil (μg g-1) as
affected by biochar amendment. Values followed by a different letter are
significantly different at p<0.10.
1.4
1.2
12000
1
Effect of Biochar Addition on Soil pH
and Electrical Conductivity
10000
0.8
0.6
b
8000
0.4
0.2
4000
0
Ag
Ag
Ag
Sim Spill Sim Spill Sim Spill Ag Saline Ag Saline Ag Saline
Control C Control Control
C
W
WS
C
W
WS
W
WS
Treatment
Figure 1. Average canola biomass according to soil and treatment. W
denotes willow biochar, WS denotes wheat straw biochar and C
denotes Control. Bars are standard error.
2000
c
0
Agricultural Control
Simulated Spill
Soil Utilized
Agricultural Saline
Treatments receiving the addition of either willow
or wheat straw biochar were found to have a
higher pH than the control treatment (Figure 5).
The liming effect of the biochar is explained by
the high content of Ca and Na carbonates and
oxides present in the biochar.
7.3
Figure 3. Average sodium concentrations in canola dry biomass (μg Na
g-1) by soil utilized. Values followed by a different letter are significantly
different at p<0.10.
Effect of Biochar Addition on Ca
Concentration in Soil
Canola (B. napus) was grown in a four week
pot study and biomass yield determined.
References: Brady and Weil, 2008. Pearson Prentice Hall. Upper Saddle River, New Jersey.
Chapman and Kelly. 1930. Soil Sci. 30: 391-406.
Jiang et al., 2012. Journal of Hazardous Materials. 229-230: 145-150.
Sohi et al., 2010. Academic Press, Burlington. p. 47-82.
Thomas et al., 1967. Agron. J. 99: 240-243.
b
1500
a
Higher soil Ca concentrations were observed when
willow biochar was applied to the soil compared to
either the control treatment or when wheat straw
biochar was applied (Figure 4).
96 ppb
46 ppb 23 ppb Control
184 ppb
69 ppb
Figure 2. Photos of plant
treatments
one
month of growth. Agricultural
Control (above left), Agricultural Saline (above right), and Simulated
Spill (below).
This may be expected given the high content of Ca
found within the willow biochar compared to the
wheat straw biochar (33.74% and 4.81%
respectively).
Average pH
a
7.2
7.1
b
7
6.9
6.8
6.7
Willow
An acid digest of the dry plant matter was
completed (Thomas et al., 1967) and an
ammonium acetate extraction was conducted on
all soil treatments. Sodium and calcium were
measured.
b
1000
pH
Materials and Methods
3000
0
6000
The objective of this study was to determine the
ability of two biochars derived from two different
feedstocks to reduce the adverse effects of salt
contamination of a soil.
Average Calcium in Soil
Ca (μg g-1)
Addition
Na (μg g-1)
Excessive amounts of soluble salts within the soil
profile represent a significant yield-limiting factor.
Plant growth in these soils is inhibited due to 1)
osmotic effects, whereby water uptake is reduced,
and 2) specific ion effects, in which certain ions
become toxic to plants or the uptake of essential
ions is impeded (Brady and Weil, 2008).
Effect of Biochar
Biomass Production
Biomass (g)
Introduction
Wheat Straw
Biochar Applied
Control
Figure 5. Average soil pH values according to biochar applied.Values
followed by a different letter are significantly different at p<0.10.
Biochar addition did not significantly affect soil
electrical conductivity.
Conclusion: The two biochars had a
liming effect but did not mitigate the
effects of high salt load in this prairie soil.
Acknowledgements: Financial support by the Agriculture Development Fund

