Get full text report
advertisement
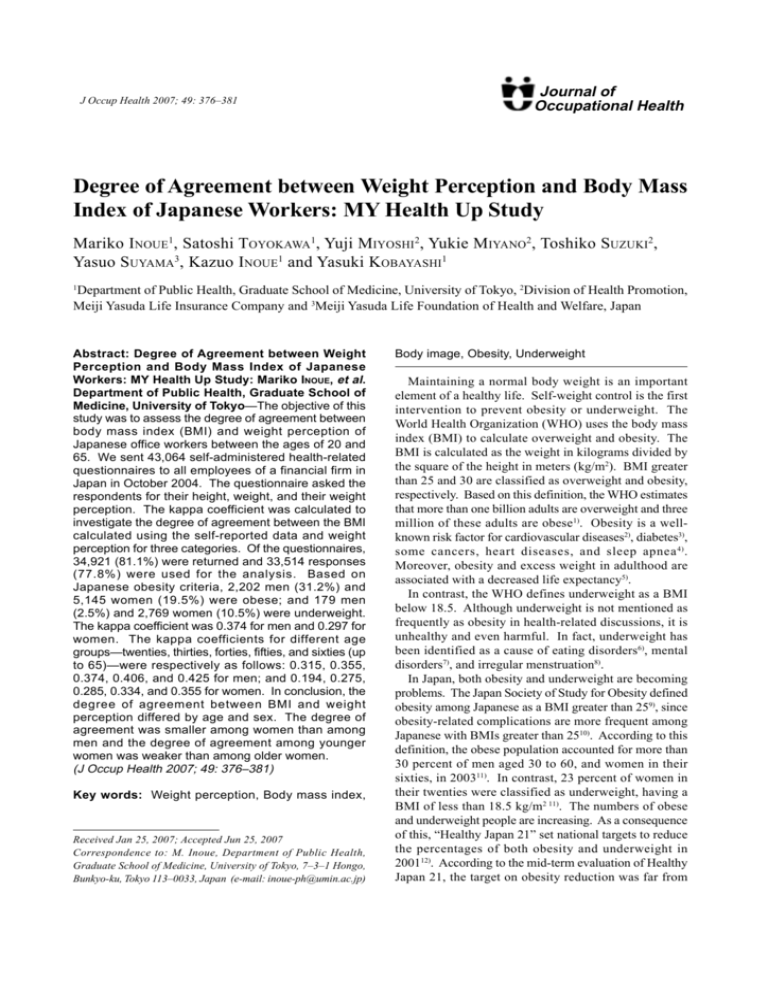
J Occup Health 2007; 49: 376–381 Journal of Occupational Health Degree of Agreement between Weight Perception and Body Mass Index of Japanese Workers: MY Health Up Study Mariko INOUE1, Satoshi TOYOKAWA1, Yuji MIYOSHI2, Yukie MIYANO2, Toshiko SUZUKI2, Yasuo SUYAMA3, Kazuo INOUE1 and Yasuki KOBAYASHI1 1 Department of Public Health, Graduate School of Medicine, University of Tokyo, 2Division of Health Promotion, Meiji Yasuda Life Insurance Company and 3Meiji Yasuda Life Foundation of Health and Welfare, Japan Abstract: Degree of Agreement between Weight Perception and Body Mass Index of Japanese Workers: MY Health Up Study: Mariko INOUE, et al. Department of Public Health, Graduate School of Medicine, University of Tokyo—The objective of this study was to assess the degree of agreement between body mass index (BMI) and weight perception of Japanese office workers between the ages of 20 and 65. We sent 43,064 self-administered health-related questionnaires to all employees of a financial firm in Japan in October 2004. The questionnaire asked the respondents for their height, weight, and their weight perception. The kappa coefficient was calculated to investigate the degree of agreement between the BMI calculated using the self-reported data and weight perception for three categories. Of the questionnaires, 34,921 (81.1%) were returned and 33,514 responses (77.8%) were used for the analysis. Based on Japanese obesity criteria, 2,202 men (31.2%) and 5,145 women (19.5%) were obese; and 179 men (2.5%) and 2,769 women (10.5%) were underweight. The kappa coefficient was 0.374 for men and 0.297 for women. The kappa coefficients for different age groups—twenties, thirties, forties, fifties, and sixties (up to 65)—were respectively as follows: 0.315, 0.355, 0.374, 0.406, and 0.425 for men; and 0.194, 0.275, 0.285, 0.334, and 0.355 for women. In conclusion, the degree of agreement between BMI and weight perception differed by age and sex. The degree of agreement was smaller among women than among men and the degree of agreement among younger women was weaker than among older women. (J Occup Health 2007; 49: 376–381) Key words: Weight perception, Body mass index, Received Jan 25, 2007; Accepted Jun 25, 2007 Correspondence to: M. Inoue, Department of Public Health, Graduate School of Medicine, University of Tokyo, 7–3–1 Hongo, Bunkyo-ku, Tokyo 113–0033, Japan (e-mail: inoue-ph@umin.ac.jp) Body image, Obesity, Underweight Maintaining a normal body weight is an important element of a healthy life. Self-weight control is the first intervention to prevent obesity or underweight. The World Health Organization (WHO) uses the body mass index (BMI) to calculate overweight and obesity. The BMI is calculated as the weight in kilograms divided by the square of the height in meters (kg/m2). BMI greater than 25 and 30 are classified as overweight and obesity, respectively. Based on this definition, the WHO estimates that more than one billion adults are overweight and three million of these adults are obese1). Obesity is a wellknown risk factor for cardiovascular diseases2), diabetes3), some cancers, heart diseases, and sleep apnea 4) . Moreover, obesity and excess weight in adulthood are associated with a decreased life expectancy5). In contrast, the WHO defines underweight as a BMI below 18.5. Although underweight is not mentioned as frequently as obesity in health-related discussions, it is unhealthy and even harmful. In fact, underweight has been identified as a cause of eating disorders6), mental disorders7), and irregular menstruation8). In Japan, both obesity and underweight are becoming problems. The Japan Society of Study for Obesity defined obesity among Japanese as a BMI greater than 259), since obesity-related complications are more frequent among Japanese with BMIs greater than 2510). According to this definition, the obese population accounted for more than 30 percent of men aged 30 to 60, and women in their sixties, in 200311). In contrast, 23 percent of women in their twenties were classified as underweight, having a BMI of less than 18.5 kg/m2 11). The numbers of obese and underweight people are increasing. As a consequence of this, “Healthy Japan 21” set national targets to reduce the percentages of both obesity and underweight in 200112). According to the mid-term evaluation of Healthy Japan 21, the target on obesity reduction was far from Mariko INOUE, et al.: Weight Perception and Body Mass Index of Japanese Workers being met in men in their thirties to sixties; rather, the prevalence of obesity in this population had increased13). Regardless of whether a person is obese or underweight, one main aspect of weight control is behavioral change. Weight perception plays an important role in managing and maintaining an appropriate body weight. Weight perception can overlook obesity or underweight, thereby missing an opportunity for subjective control of weight. Thus, encouraging people to perceive weight appropriately may be an alternative and effective method for managing body weight. Despite the importance of weight perception, only a few studies have examined the differences between weight perception and actual values 14–16). One recent study suggested the importance of weight perception combined with BMI17). In addition, Brener confirmed that body weight perception was a strong determinant of adolescents’ nutritional habits and effective weight management18). Few studies, however, have investigated the degree of agreement between weight perception and BMI among working populations although the workplace is one of the most important settings for health promotion. Only one study has focused on weight perception in a working population, but it did not examine the degree of misperception by age19). Another study focused on the adult population in the United States20). It found that misperception of weight is related to age group and ethnic background. However, no studies have so far been performed among Asian working populations. Therefore, this study assessed the degree of agreement between BMI and weight perception in Japanese men and women between the ages of 20 and 65. Methods Subjects In 2004, we started the MY Health Up Study, which periodically surveys the health status of a working population by health check-ups and questionnaire in order to maintain and promote health. The participants are employees of a financial firm in Japan with a head office in Tokyo and branches throughout Japan. Employees from both the head office and the branches participated in this study. In October 2004, as a part of the MY Health Up Study, we sent self-administered questionnaires via the company’s internal mail service. Recipients were asked to fill them in and to send them back in the enclosed envelopes. The questionnaire asked about health status, height, weight, weight perception and lifestyle. In total, 43,064 questionnaires had been sent as of October 1, 2004 and 34,921 questionnaires were returned (response rate of 81.1 percent). Besides the questionnaire, we collected height and weight data from the firm’s annual health check-up records, which are regulated by the Industrial Safety and Health Law. In 2004, the health check-up took place 377 from April to June and 44,991 employees were examined. These values were used to confirm the accuracy of the self-reported values. We excluded respondents who did not answer at least one of the following questions: age, sex, height, weight, and weight perception. In addition, men older than 65 yr old and/or sales staff were omitted as only a small number of employees fell into these two categories. Respondents whose data were not confirmed by the annual health check-up were also excluded. Thus, 1,407 respondents were excluded, leaving the data of 33,514 employees to be analyzed. The Institutional Review Board of the University of Tokyo approved this study protocol after due consideration of ethical issues. Measurements Participants were asked to provide their self-reported height and weight data in centimeters and kilograms down to one decimal place. Participants’ BMIs were calculated as the weight in kilograms divided by the square of the height in meters. For the health check-up, occupational nurses used scales to measure height in centimeters and weight in kilograms. Participants’ weight perception was determined according to their response to the question: “Do you think your weight is average?” Participants could choose one of the following answers: 1) overweight, 2) slightly overweight, 3) average, 4) slightly underweight, and 5) underweight. These responses to the weight perception in the questionnaire were summarized into three categories, overweight (Categories 1 and 2 of the original variable), average, or underweight (Categories 4 and 5), since less than one percent of respondents chose the extreme options, of overweight and underweight. Statistical analysis We compared absolute values of both self-reported and measured height and weight. Pearson’s correlation coefficients between the self-reported and measured height and weight were then calculated. This analysis was to confirm the concordance between self-reported and measured values. Then, the kappa coefficient (κ) was calculated to assess the degree of agreement between BMI and weight perception. The kappa coefficient is a measure of agreement: κ=1 is perfect agreement while κ=0 is the weakest agreement. For the kappa coefficient analysis, we divided the BMI data into three categories according to definitions of the Japan Society for the Study of Obesity: BMI<18.5, underweight; 18.5≤BMI<25.0, normal; and 25.0≤BMI, obese9). Results Of the 33,514 participants, 7,058 were men and 26,456 were women (Table 1). 378 J Occup Health, Vol. 49, 2007 Table 1. Characteristics of the study population of the MY Health Up Study Male (n= 7,058) Age (SD) Occupation Office staff Sales staff Measured height (SD) Self-reported height (SD) Measured weight (SD) Self-reported weight (SD) Body mass index calculated by self-reported data (SD) 42.0 7,058 0 171.1 cm 171.4 cm 69.9 kg 69.9 kg 23.8 kg/m2 Female (n= 26,456) (10.6) (100.0%) (0.0%) (6.0) *1 (5.9) (10.7) *3 (10.4) (3.1) 44.4 6,563 19,893 156.7 cm 156.8 cm 55.0 kg 54.8 kg 22.3 kg/m2 (10.5) (24.8%) (75.2%) (5.4) *2 (5.3) (9.5) *4 (8.9) (3.5) *1: r=0.990; *2: r=0.987; *3: r=0.982; *4: r=0.975; p<0.001 (Pearson’s correlation); SD stands for standard deviation. Table 2. Body mass index (BMI) calculated using the self-reported data by age and sex BMI<18.5 Male 20–29 yr old (n=1,003) 30–39 yr old (n=2,271) 40–49 yr old (n=1,615) 50–59 yr old (n=1,952) 60–65 yr old (n=217) All age groups (n=7,058) Female 20–29 yr old (n=2,824) 30–39 yr old (n=5,857) 40–49 yr old (n=7,869) 50–59 yr old (n=8,710) 60–65 yr old (n=1,196) All age groups (n=26,456) 18.5≤BMI<25.0 25.0≤BMI 46 58 23 48 4 179 (4.6) (2.6) (1.4) (2.5) (1.8) (2.5) 759 1,521 1,009 1,240 148 4,677 (75.7) (67.0) (62.5) (63.5) (68.2) (66.3) 198 692 583 664 65 2,202 (19.7) (30.5) (36.1) (34.0) (30.0) (31.2) 617 970 695 435 52 2,769 (21.8) (16.6) (8.8) (5.0) (4.3) (10.5) 1,996 4,102 5,741 5,919 784 18,542 (70.7) (70.0) (73.0) (68.0) (65.6) (70.1) 211 785 1,433 2,356 360 5,145 (7.5) (13.4) (18.2) (27.0) (30.1) (19.4) BMI was calculated as the weight in kilograms divided by the square of the height in meters. Percentages are in parentheses. The mean age was 42.0 (standard deviation (SD) 10.6) yr in men and 44.4 (SD 10.5) in women. In terms of occupation, 100 percent of the men were office staff and 75.2 percent of the women were sales staff who spent most of their time in the field. The average differences between self-reported and measured height were 0.3 centimeters in men and 0.1 centimeters in women. The average self-reported and measured weight was the same in men, while it was slightly less in women (0.2 kg). In each case, Pearson’s correlation coefficient between self-reported and measured value was more than 0.980 for men and 0.970 for women (p<0.001). The mean self-reported BMI in each age group is provided in Table 2. Overall, 66.3 percent of men and 70.1 percent of women fell within the normal range. While 31.2 percent of men and 19.4 percent of women were obese, 2.5 percent of men and 10.5 percent of women were underweight. Among men, 75.7 percent of those in their twenties were most likely to fall within the normal BMI range (Table 2). The most obese age group was men in their forties and the most underweight age group was men in their twenties. Among women, the younger age groups were more likely to be categorized as underweight while the older age groups were categorized as obese. Table 3 shows that 4,286 (60.7 percent) of 7,058 men and 14,205 (53.7 percent) of 26,456 women matched their BMI category with their weight perception. Thus, 39.3 percent of men and 46.3 percent of women inaccurately Mariko INOUE, et al.: Weight Perception and Body Mass Index of Japanese Workers 379 Table 3. Agreement between BMI and weight perception by sex Weight perception Underweight Male (n=7,058) BMI<18.5 18.5≤BMI<25.0 25.0≤BMI Female (n=26,456) BMI<18.5 18.5≤BMI<25.0 25.0≤BMI Normal Overweight Total 174 781 1 (97.2) (16.7) (0.1) 4 (2.2) 1 (0.6) 1,956 (41.8) 1,940 (41.5) 45 (2.0) 2,156 (97.9) Kappa coefficient=0.374 179 (100.0) 4,677 (100.0) 2,202 (100.0) 1,795 1,000 6 (64.8) (5.4) (0.1) 868 (31.4) 106 (3.8) 7,288 (39.3) 10,254 (55.3) 17 (0.3) 5,122 (99.6) Kappa coefficient=0.297 2,769 (100.0) 18,542 (100.0) 5,145 (100.0) Percentages are in parentheses. Table 4. Degrees of agreement between BMI and the weight perception for three categories by age and sex Age groups 21–29 yr old 30–39 yr old 40–49 yr old 50–59 yr old 60–65 yr old Kappa coefficient Male Female (n=7,058) (n=26,456) 0.315 0.355 0.374 0.406 0.425 0.194 0.275 0.285 0.334 0.355 perceived their weight. The kappa coefficient was calculated to investigate the degree of agreement between self-reported BMI and weight perception. The men’s kappa coefficient was 0.374 and women’s was 0.297 (Table 3). Likewise, the degree of agreement was examined in each age group (Table 4), and men’s kappa coefficients were consistently larger than women’s in all age groups. Discussion We found that the degree of agreement between BMI and weight perception varied according to age and sex. Women had a smaller degree of agreement than men since men’s kappa coefficients were larger than women’s in all age groups. Furthermore, this smaller degree of agreement was much more evident in younger women than in older women. This disagreement may accelerate excessive weight loss or weight gain. Judging from Landies and Koch’s assessment21), in the present study, the kappa coefficient of women in their twenties, κ=0.194, shows extremely poor agreement between BMI and weight perception among young women. While all men were office staff, women were classified as sales and office staff and the different working styles might have affected our results. When we compared only male and female office staff, the severity of misperception between BMI and weight perception by sex had the same tendency; for example, the kappa coefficient was 0.315 for male office staff, 0.182 for female office staff, and 0.199 for female sales staff in their twenties. The slight difference between female office staff and sales staff remains to be examined, because the subjects were different in not only working styles but also marriage status, smoking habits, and so on. Our results provide evidence about different types of misperception between men and women. Among those whose BMIs were less than 18.5, 6.3 percent of the women in their twenties perceived that they were obese. Women in their twenties were most vulnerable to such an extreme misperception, but we found the same misperception in women of all ages. On the other hand, few men with a BMI less than 18.5 perceived themselves as obese in all age groups. We found subjects with BMIs in the normal range who perceived themselves as obese. In this group, 55.3 percent of the women saw themselves as obese. Even among men in their sixties—the most accurately self-evaluated group—33.1 percent of those within the normal BMI range perceived themselves as obese. Several participants within the normal BMI range perceived themselves as underweight. Among those whose BMIs fell within the normal range, only 3.4 percent of the women in their twenties evaluated themselves as underweight while 17.6 percent of the men in their sixties did. Thus, we can conclude that the manner of misperception differs by age and sex. Two types of 380 misperception became evident: one is that people claim to weigh more than they do, and the other is that people claim to weigh less than they do. In the former case, previous studies have argued that social and cultural issues influence youth body image, leading them to an incorrect perception of their weight. Television, magazines, and peer pressure have been found to influence body image22). A recent survey revealed that being overweight or obese can lead to discrimination or teasing in schools 23). Throughout their school life, students perceive that their obese or overweight classmates are unpopular. Also, people who develop lower self-esteem during childhood are associated with having a poor body image24). Such early exposures might influence the rest of a person’s life. Disagreement existed among the middle-aged population, although the degrees of disagreement between BMI and weight perception were not as severe as those among the younger population based on the values of the kappa coefficients. Thus, this disagreement is not a youthspecific problem. Nowadays, obesity is not related to a good image, especially in work settings. For example, obesity is associated with laziness and a lack of selfcontrol25). This social norm might influence the middleaged population. Peer pressure exists even among adults26). The misperception, in which people claim to weigh less than they do, was found especially in the older population. Today, this misperception can be related to a dynamic shift in the recognition of obesity. In the past, being fat was a symbol of wealth and health27). Thus, it is difficult for people to change the habits and routines that they think are good for them. In addition, stressful situations in Japanese workplaces have been reported to change eating and exercise patterns28). Lifestyles have been changed to more convenient ways by transportation and machines which support our daily life. These changes have limited physical exercise in our contemporary society but not calorie intake. The stratification of our study population by the three obesity categories was not different from the result of the National Health and Nutrition Survey of 2004. Even when we included the 1,407 cases excluded because of incomplete answers in the analysis, the population distribution of obesity and kappa coefficients for degrees of agreement between BMI and weight perception were not much different. The kappa coefficient differed only in the third decimal place. Thus, our result was stable whether we included or excluded the case of incomplete answers. Our findings are consistent with the results of previous studies. Weight perception was inconsistent with body image in pre-adolescent, adolescent, and young populations29, 30) as well as in adults31). In a previous study in the U.K 19) , women were more likely to regard J Occup Health, Vol. 49, 2007 themselves as too heavy. The degree of agreement in our study was worse than that found for US adults by the values of the kappa coefficients20). Similar to a study on the perception of body image in the European Union, more overweight men had an incorrect body image of normal or underweight than women32). We also found that younger age groups were more likely to misperceive themselves. A previous study found that Japanese preadolescents and adolescents showed a desire to lose weight33). There are several limitations in this study. First, the self-assessment of weight was subjective because no reference points were provided. Still, direct selfperception is an indispensable first step in changing behavior. Second, we used self-reported height and weight, because they were a sufficiently accurate predictor of measured values in past epidemiological studies34). There was four to six month’s time lag between the measured values and the self-reported values which might have influenced our results. However, the self-reported values and measured values were highly correlated as shown in Table 1. The difference of paired values was less than 0.3 cm for height and 0.2 kg for weight on average. Third, since our study population consisted of workers, they might be healthier and more healthconscious than the general population of the same age groups. Fourth, the inclusion of pregnant women may have lead to misclassification. However, women in the third trimester of pregnancy were rare in this study population, therefore, they did not affect our results. Finally, we measured obesity only with BMI. BMI does not measure distribution of fat and, therefore, is not a perfect indicator of obesity. In addition, for this reason, we could not distinguish the causes of weight misperception. Despite these limitations, we consider this study has revealed the degrees of agreement between BMI and weight perception both in young and middle-aged working populations. Based on our findings, we should be able to design a health education program in working settings that would allow employees to change their behavior and maintain an appropriate body weight. References 1) WHO. Quantifying selected major risks to health. In: WHO, ed. The world health report 2002: reducing risks, promoting healthy life. Geneva: WHO, 2002: 49–97. 2) Hubert HB, Feinleib M, McNamara PM and Castelli WP: Obesity as an independent risk factor for cardiovascular disease: a 26-year follow-up of participants in the Framingham Heart Study. Circulation 67, 968–977 (1983) 3) Mokdad AH, Ford ES, Bowman BA, Dietz WH, Vinivor F, Bales VS and Marks JS: Prevalence of obesity, diabetes, and obesity-related health risk factors. JAMA 289, 76–79 (2001) Mariko INOUE, et al.: Weight Perception and Body Mass Index of Japanese Workers 4) Pi-Sunyer FX: Medical hazards of obesity. Ann Intern Med 119, 655–660 (1993) 5) Peeters A, Barendregt JJ, Willekens F, Mackenbach JP, Mamun AA and Bonneux L: Obesity in adulthood and its consequences for life expectancy: a Life-Table Analysis. Ann Intern Med 138, 24–31 (2003) 6) Fairburn CG and Harrison PJ: Eating disorders. Lancet 361, 407–416 (2003) 7) Wakeling A: Epidemiology of anorexia nervosa. Psychiatry Res 62, 3–9 (1996) 8) Montero P, Bernis C, Fernandez V and Castro S: Influence of body mass index and slimming habits on menstrual pain and cycle irregularity. J Biosoc Sci 28, 315–323 (1996) 9) Japan Society for the Study of Obesity: New definition and diagnostic standard of obesity. Himan Kenkyu 6, 18–28 (2000) (in Japanese) 10) The Examination Committee of Criteria for ‘Obesity Disease’ in Japan, Japan Society for the Study of Obesity: New criteria for “obesity disease” in Japan. Circ J 66, 987–992 (2002) 11) Ministry of Health, Labor, and Welfare. The National health and nutrition survey in Japan, 2003. Tokyo: Ministry of Health, Labour, and Welfare, 2005: 149– 184 (in Japanese). 12) Committee for Healthy Japan 21. Report on Healthy Japan 21. Tokyo: Ministry of Health, Labour, and Welfare, 2000: 55–67 (in Japanese). 13) Healthy Japan 21 Mid-term Evaluation Team. Mid-term report on Healthy Japan 21. Tokyo: Ministry of Health, Labour, and Welfare, 2006: 10–14 (in Japanese). 14) Chang VW and Christakis NA: Extent and determinants of discrepancy between self-evaluations of weight status and clinical standards. J Gen Intern Med 16, 538– 543 (2001) 15) Madrigal H, Sánchez-Villegas A, Martinez-González A, Kearney J, Gibney MJ, de Irala J and Martinez JA: Underestimation of body mass index through perceived body image as compared to self-reported body mass index in the European Union. Public Health 114, 468– 473 (2000) 16) Xie B, Chou CP, Spruijt-Metz D, Reynolds K, Clark F, Palmer PH, Gallaher P, Sun P, Guo Q and Johnson CA:Weight perception and weight-related sociocultural and behavioral factors in Chinese adolescents. Prev Med 42, 229–234 (2006) 17) Mack KA, Anderson L, Galuska D, Zeblotsky D, Holtzman D and Ahluwalia I: Health and sociodemographic factors associated with body weight and weight objectives for women: 2000 Behavioral Risk Factor Surveillance System. J Womens Health 13, 1019–1032 (2004) 18) Brener ND, Eaton DK, Lowry R and McManus T: The association between weight perception and BMI among high school students. Obes Res 12, 1866–1874 (2004) 19) Emslie C, Hunt K and Macintyre S: Perceptions of 20) 21) 22) 23) 24) 25) 26) 27) 28) 29) 30) 31) 32) 33) 34) 381 body image among working men and women. J Epidemiol Community Health 51, 406–407 (2001) Chang VW and Christakis NA: Self-perception of weight appropriateness in the United States. Am J Prev Med 24, 332–339 (2003) Landies JR and Koch GG: The measurement of observer agreement for categorical data. Biometrics 33, 159–174 (1977) Thompson JK and Heinberg LJ: The media’s influence on body image disturbance and eating disorders: we’re reviled them, now can we rehabilitate them? J Soc Issues 55, 339–353 (1999) Wardle J, Waller J and Fox E: Age of onset and body dissatisfaction on obesity. Addict Behav 27, 561–573 (2002) Cramer P and Steinwert T: Thin is good, fat is bad: how early does it begin? J Appl Dev Psychol 19, 429– 451 (1998) Puhl RM and Brownell KD. Bias, prejudice, discrimination, and obesity. In: Bray GA, Bonchad C, eds. Handbook of obesity, 2nd ed. New York: Marcel Dekker Inc, 2004: 97–114. Paquette MC and Raine K: Sociocultural context of women’s body image. Soc Sci Med 59, 1047–1058 (2004) Cassidy CM: The good body: when big is better. Med Anthropol 13, 181–213 (1991) Nishitani N and Sakakibara H: Relationship of obesity to job stress and eating behavior in male Japanese workers. Int J Obes 30, 528–533 (2006) Canpolat BI, Orsel S, Akdemir A and Ozbay MH: The Relationship between dieting and body image, body ideal, self-perception, and body mass index in Turkish adolescents. Int J Eat Disord 37, 150–155 (2005) Fonseca H and Gaspar de Matos M: Perception of overweight and obesity among Portuguese adolescents: an overview of associated factors. Eur J Public Health 15, 323–328 (2005) Fitzgibbon ML, Blackman LR and Avellone ME: The relationship between body image discrepancy and body mass index across ethnic groups. Obes Res 8, 582– 589 (2000) Sánchez-Villegas A, Madrigal H, Martinez-González A, Kearney J, Gibney MJ, de Irala J and Martinez JA: Perception of body image as indicator of weight status in the European Union. J Hum Nutr Diet 14, 93–102 (2001) Kaneko K, Kiriike N, Ikenaga K, Miyawaki D and Yamagami S: Weight and shape concerns and dieting behaviours among pre-adolescents and adolescents in Japan. Psychiatry Clin Neurosci 53, 365–371 (1999) Hunter D. Anthropometric Measures and Body Composition. In: Willett W, ed. Nutritional Epidemiology, 2nd ed. New York: Oxford University Press, 1998: 244–272.


