6.2
Energy Use and the Atmosphere
Purpose
Introduction
Explore one of the global environmental issues associated with increased
combustion of fossil fuels.
Carbon dioxide (CO2) is a colorless, odorless gas. It is a natural part of Earth’s atmosphere
and is important to all life on our planet. All plants and animals release CO2 to the atmosphere during respiration. Green plants and other producers remove some of this CO2 for
use during photosynthesis. Large amounts of atmospheric CO2 become dissolved in
Earth’s bodies of water, especially the oceans. Nature has evolved to create a balanced
situation in which annual CO2 inputs to the atmosphere and CO2 outputs from the atmosphere are roughly equal.
In recent years, standards of living and levels of technology use have risen considerably throughout the world, particularly in the
United States. As a result, energy use has
also risen considerably, as shown in the
graph in Figure 2. Much of the energy used
in the United States comes from the burning
of fossil fuels, which include coal, natural
gas, and petroleum. Burning these fuels produces not only heat and light, but also considerable amounts of CO2.
What are the possible global consequences
of this increase in CO2 production? Have
increases in CO2 production affected the
natural balance of CO2 in the atmosphere?
70
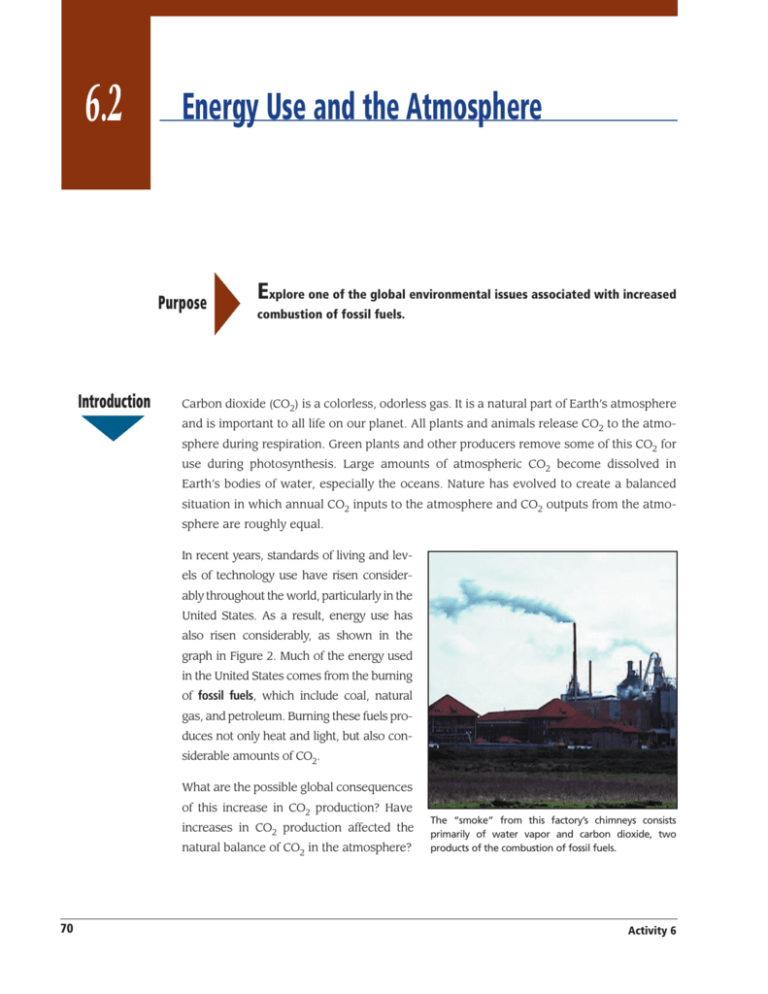
The “smoke” from this factory’s chimneys consists
primarily of water vapor and carbon dioxide, two
products of the combustion of fossil fuels.
Activity 6
Energy Use and the Atmosphere
6.2
Figure 2 Energy Use in the United States
100
90
80
70
Exajoules*
60
50
40
30
20
10
0
1880 1890 1900 1910 1920 1930 1940 1950 1960 1970 1980 1990
*1 exajoule = 1018 joules
Materials
For each student
1
Procedure
Year
sheet of graph paper
1. Based on the data provided in Table 2, make a line graph that shows the amount of
CO2 released into the atmosphere as a result of fuel combustion from 1860 to 1990.
2. Based on the data provided in Table 2, make a scatterplot that shows Earth’s average
surface temperature from 1860 to 1990.
3. Draw a line of best fit that allows you to predict future average surface temperatures.
Record your predicted temperature for the year 2050.
Table 2
Living in Today’s World
Global Carbon Dioxide Emissions and Surface Temperatures
CO2 Emissions from
Fuel Combustion
(in billions of tons)
Year
CO2 Emissions from
Fuel Combustion
(in billions of tons)
1860
1
13.5
1930
4.5
13.8
1870
1
13.7
1940
5
14.0
1880
1.5
13.7
1950
6
13.8
1890
2
13.6
1960
10
14.0
1900
2.5
13.9
1970
13
14.0
1910
3
13.5
1980
18
14.1
1920
3.5
13.8
1990
22
14.4
Average Surface
Temperature
(in ºC)
Year
Average Surface
Temperature
(in ºC)
71
6.2
Energy Use and the Atmosphere
Analysis
?
Group Analysis
1. Briefly describe what you think could be a possible global consequence of an
increase in Earth’s average surface temperature.
2. Some people claim that having access to many goods and services can lead to a
decrease in health and well-being. Could the information presented in this activity
be used to support or refute this claim? Explain your reasoning.
Individual Analysis
3. Compare your two graphs. Explain whether or not they provide any evidence to
support the claim that increased levels of CO2 in the atmosphere lead to increased
surface temperatures.
4. What additional information would you like to have before you would be confident
in saying that increased levels of CO2 in the atmosphere definitely do or do not
lead to increased surface temperatures? Explain why this information is important.
5. Do you think society should take steps to reduce the emission of CO2 into the
atmosphere? Explain your reasoning.
72
Activity 6
Carbon Dioxide in the Atmosphere
A Comparison of the Composition of Inhaled and Exhaled Air
Components of Earth’s
Atmosphere
Composition of
Air Breathed In
(%)
Composition of
Air Breathed Out
(%)
Nitrogen
78
75
Oxygen
21
16
Argon
0.9
0.9
Carbon dioxide
0.035
4.0
Water vapor
0.4
4.0
Comparing Atmospheric Inputs and Outputs of CO2
Current Annual Release of CO2 to the Atmosphere
Amount
(billions of tonnes)
Process
Respiration
54–55
Decomposition
55
Biological/chemical oceanic processes
90
6
Total
206
Current Annual Absorption of CO2 From the Atmosphere
Amount
(billions of tonnes)
Process
Biological/chemical oceanic processes
93
Photosynthesis
à
110
Total
203
Net gain of CO2 to the atmosphere: 3 billion tonnes per year
Science and Sustainability Transparency 6.3
à
©2000 The Regents of the University of California
Wood and fossil fuel combustion
149
Comparing Trends of Surface Temperature and
Carbon Dioxide Emissions
Worldwide CO2 Emissions From Fuel Combustion
Billions of Tonnes
20
15
10
5
0
1860
1870
1880
1890
1900
1910
1920
1930
1940
1950
1960
1970
1980
1990
Years
Average Surface Temperature of Earth
15.0
Degrees Celsius
©2000 The Regents of the University of California
14.5
14.0
13.5
13.0
1860 1870 1880 1890 1900 1910 1920 1930 1940 1950 1960 1970 1980 1990 2000 2010 2020 2030 2040 2050
Years
Data source: Committee on Environment and Natural Resources, National Science and Technology Council
Science and Sustainability Transparency 6.4
151
Surface Temperature and Carbon Dioxide Levels
During the Past 160,000 Years
Average Surface Temperature of Earth (ºC)
260
240
220
2
200
0
Concentration of CO2
in the Atmosphere (ppm)
280
180
–2
–4
–6
–8
–10
©2000 The Regents of the University of California
160,000
120,000
80,000
40,000
0
Years Before 1990
Key
Temperature Data
CO2 Data
Data source: Intergovernmental Panel on Climate Change
Science and Sustainability Transparency 6.5
153
INQUIRY SCORING GUIDES
FOR HIGH SCHOOL
1. Designing Investigations
(DI)
2. Analyzing Data
(AD)
from SEPUP (Science Education for Public Understanding Program)
©2005 The Regents of the University of California. All rights reserved
T R A N S PA R E N C Y
Scoring Guide: Designing Investigations (DI)
What to Look For
Response states a design and specifies data to be collected for the investigation.
Procedures are described completely and accurately.
Level 4
Above and beyond
Student accomplishes Level 3 and goes beyond in some significant way such as:
• identifying alternate procedures.
• suggesting improved materials.
• relating clearly to scientific principles and approaches.
Level 3
Complete and correct
Student’s design is appropriate and has a reproducible procedure, if required.
Level 2
Almost there
Student’s design or procedure is incomplete AND/OR has significant errors.
Level 1
On your way
Student’s design or procedure is incorrect or demonstrates a lack of
understanding of the goals of the investigation.
Level 0
X
Student’s design or procedure is missing, illegible, or irrelevant.
Student had no opportunity to respond.
from SEPUP (Science Education for Public Understanding Program)
©2005 The Regents of the University of California. All rights reserved
T R A N S PA R E N C Y
Scoring Guide: Analyzing Data (AD)
What to Look For
Response accurately summarizes data, detects patterns and trends, and draws valid
conclusions based on the data used.
Level 4
Above and beyond
Level 3
Complete and correct
Student accomplishes Level 3 AND goes beyond in a significant way, such as
• explaining unexpected results.
• judging the value of investigation.
• suggesting additional relevant investigation.
• Student analyzes and interprets data correctly and completely
• Student’s conclusion is compatible with the analysis of the data.
Level 2
Almost there
Level 1
Student notes patterns or trends BUT does so incompletely.
On your way
Student attempts an interpretation, BUT
• ideas are illogical OR
• ideas show a lack of understanding.
Level 0
Student’s analysis or interpretation of data is missing or illegible.
X
Student had no opportunity to respond.
from SEPUP (Science Education for Public Understanding Program)
©2005 The Regents of the University of California. All rights reserved
Activity:
Variable:
Date:
ID
Moderated
MODERATORS
Student
A
B
C
D
E
F
Score
SEPUP Assessment System ©The Regents of the University of California
Exemplars of Student Work
AD (Analyzing Data)
Science and Sustainability Activity 6.2, Question 3
The question
Compare your two graphs. Explain whether or not they provide any evidence to
support the claim that increased levels of CO2 in the atmosphere lead to increased
surface temperatures.
What to look for
Response accurately summarizes data, detects patterns and trends, and draws
valid conclusions based on the data used.
Student Work
Student A
The graph of the average surface temperature increased, but it did not increase a
whole lot. The temperature only increased almost one whole degree in 130 years.
The graph of the CO2 emissions also increased and it increased more than the
temperature. The CO2 emissions increased by 21 billion tons. Even though both
graphs increased, I do not think that the amount of CO2 in the atmosphere causes
the surface temperature to rise. I think this because in some years, when the CO2
emissions were higher than they were the year before, the surface temperature
decreased from the year before. Therefore I don’t think that my graph has the
evidence to support the claim that increased levels of CO2 in the atmosphere lead to
increased temperatures.
Student B
Both graphs go up slow until about 1950. Then they both go up faster. The CO2
must be causing the temperature to go up. I’ve heard of global warming. It’s a big
problem.
Student C
The CO2 increased a lot and the temperature increased a little bit so, my graphs
provide a lot of evidence to support that increased levels of the carbon dioxide
caused temperature increases every decade and it also shows if it decreases or not.
It shows how much the increase is and what is going to happen in the future with
our atmosphere.
Student D
The reason that they go up because of the CO2 is giving the plants and all oxygen.
Plants make oxygen and since we’re cutting down rainforests, ther is less oxygen,
which makes more room for CO2.
© 2005 The Regents of the University of California
p. 1
Student E
The Earth’s average surface temperature increased about 1 degree from 1860 to
1990. The CO2 emissions increased a lot more than the temperature. Sometimes the
temperature went down, even when the emissions went up (for example in 1950). I
think this could be because the surface temperature depends on the weather. The
weather changes for lots of reasons from one year to the next. I think the graphs
show that increased levels of CO2 in the atmosphere may lead to increased
temperatures on average. But that isn’t the whole picture. Other things can affect
the temperature of the Earth.
Student F
There is a sufficient amount of evidence that increased levels of carbon dioxide in
the atmosphere lead to increased temperatures. From 1860 to 1910 however, the
relationship is inconclusive because the temperature in 1860 is the same as it is in
1910, while the carbon dioxide emissions were steadily increasing. The obvious
similarities started in 1920, possibly because there were 60,000 automobiles in the
U.S. in 1911, a large increase from just 10 years earlier. From 1920 on, the
temperature continued to rise as the carbon dioxide emissions rose as well. The
most obvious similarities were in 1990, when the amount of carbon dioxide
emissions jumped from 18 billion tons in 1980 to 22 billion tons in 1990, we also see
the largest rise in temperature. Although there were a few years when CO2
emissions and temperature did not follow the same trend, it appears that there is a
relationship between them. I believe that the effect of the increased use of
automobiles should be investigated further as a possible cause for both the increase
in CO2 emissions and the increase in temperature.
Student G
I think that it had to increase when every time the temperature increased or
dropped, the CO2 combustion went up a little bit, but the temperature had to
increase in order for the combustion to go up. Where if the temperature remained
the same, the combustion remained the same.
© 2005 The Regents of the University of California
p. 2


