February 17, 2014
Flash Note
Tessa Vania Mulia
Equity Analyst
Tessa.mulia@sinarmassekuritas.co.id
(021) 392 5550 ext. 610
BANK MANDIRI
LOWER CREDIT GROWTH
Tbk provides
PT Bank Rakyat
Mandiri Indonesia
(Persero) (Persero)
Tbk is formed
by the
commercial
banking
and
its Ptrelated
merger
of four
state-owactivities
ned banks,
namely
Bank
services.
ThePT
Bank
alsoDagang
providesNegara,
banking PT
activities
Bumi
Daya,
Bank
Bank
based onImport
shariah
principles.(Bank Exim), PT Bank
Ekspor
Indonesia
Pembangunan Indonesia (Bank Bapindo). The Bank
operates in the commercial banking services.
BMRI IJ
160
950 0
140
900 0
120
850 0
100
800 0
80
750 0
60
40
700 0
20
650 0
0
Feb-13
600 0
May-13
Volume
Aug-13
Nov-13
BANK MANDIRI PERSERO TBK PT
Price Perform ance
Price
Price Perform ance
52 Week High
Price
52 Week Low
52 Week High
52 Week Beta
52 Week Low
52 Week Beta
1M Return
6M
1MReturn
Return
52
6MWeek
ReturnReturn
YTD
Return
52 Week
Return
Source:
Bloomberg
YTD Return
Source: Bloomberg
Stock Inform ation
Outstanding
Shares
Stock Inform
ation (M)
Outstanding Shares (M)
Floating
Floating
Ow
nership (Institutional)
Ow nership
nership (Institutional)
Ow
(Retail & Other)
Ow
nership
(Retail & Other)
Source:
Bloomberg
Source: Bloomberg
Top Holder
Top Holder
REPUBLIC
OF INDONESI
REPUBLIC OF INDONESI
LAZARD LTD
FIL LIMITED
GIC
PRIVATE LIMITED
VANGUARD GROUP INC
FRANKLINSTANLEY
MORGAN
RESOURCES
NORGES BANK
VANGUARD
FMR
LLC
GROUP INC
SCHRODERS PLC
JPMORGAN CHASE
DIMENSIONAL
FUND&ADV
CO
Source: Bloomberg
Source: Bloomberg
9,025
10,750
8,450
950
6,250
9,950
1,740
1.53
6,200
840
1.40
1.24
3%
5%
-2%
7%
1%
-35%
-5%
15%
-34%
14%
Not Rated
Peningkatan Laba bersih 17,4%
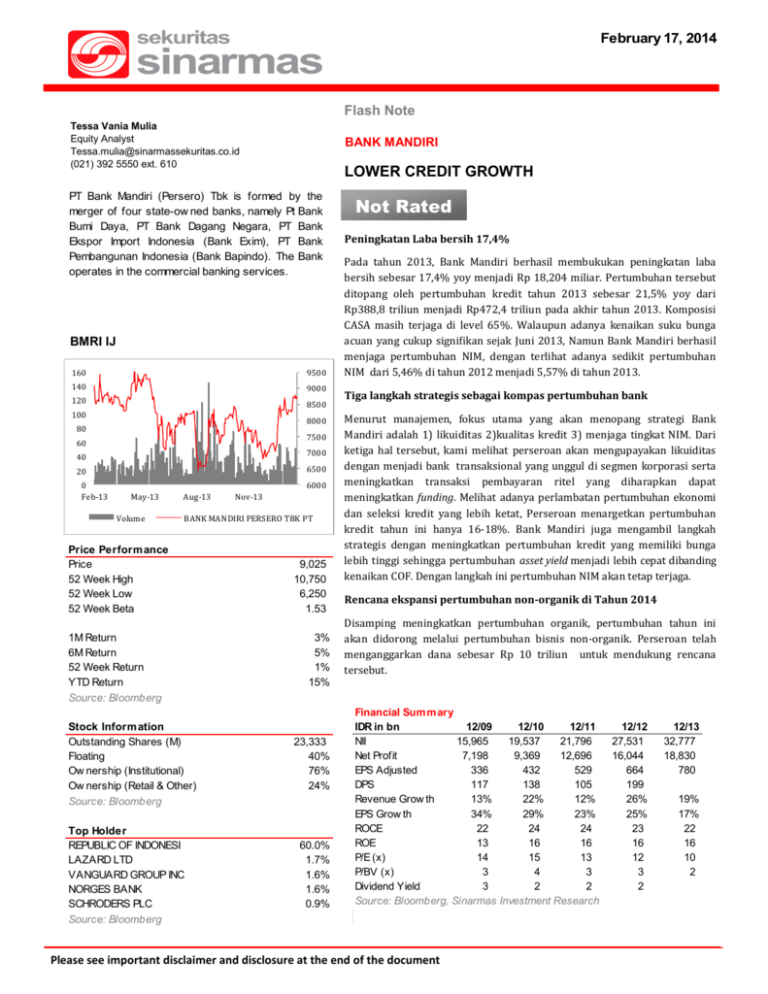
Pada tahun 2013, Bank Mandiri berhasil membukukan peningkatan laba
bersih sebesar 17,4% yoy menjadi Rp 18,204 miliar. Pertumbuhan tersebut
ditopang oleh pertumbuhan kredit tahun 2013 sebesar 21,5% yoy dari
Rp388,8 triliun menjadi Rp472,4 triliun pada akhir tahun 2013. Komposisi
CASA masih terjaga di level 65%. Walaupun adanya kenaikan suku bunga
acuan yang cukup signifikan sejak Juni 2013, Namun Bank Mandiri berhasil
menjaga pertumbuhan NIM, dengan terlihat adanya sedikit pertumbuhan
NIM dari 5,46% di tahun 2012 menjadi 5,57% di tahun 2013.
Tiga langkah strategis sebagai kompas pertumbuhan bank
Menurut manajemen, fokus utama yang akan menopang strategi Bank
Mandiri adalah 1) likuiditas 2)kualitas kredit 3) menjaga tingkat NIM. Dari
ketiga hal tersebut, kami melihat perseroan akan mengupayakan likuiditas
dengan menjadi bank transaksional yang unggul di segmen korporasi serta
meningkatkan transaksi pembayaran ritel yang diharapkan dapat
meningkatkan funding. Melihat adanya perlambatan pertumbuhan ekonomi
dan seleksi kredit yang lebih ketat, Perseroan menargetkan pertumbuhan
kredit tahun ini hanya 16-18%. Bank Mandiri juga mengambil langkah
strategis dengan meningkatkan pertumbuhan kredit yang memiliki bunga
lebih tinggi sehingga pertumbuhan asset yield menjadi lebih cepat dibanding
kenaikan COF. Dengan langkah ini pertumbuhan NIM akan tetap terjaga.
Rencana ekspansi pertumbuhan non-organik di Tahun 2014
Disamping meningkatkan pertumbuhan organik, pertumbuhan tahun ini
akan didorong melalui pertumbuhan bisnis non-organik. Perseroan telah
menganggarkan dana sebesar Rp 10 triliun untuk mendukung rencana
tersebut.
-33%
25%
23,333
24,669
10,565
40%
43%
33%
76%
73%
72%
24%
27%
28%
60.0%
60.1%
56.8%
1.7%
2.1%
6.4%
1.6%
1.5%
1.6%
1.6%
1.3%
1.4%
0.9%
1.1%
0.8%
Financial Sum m ary
IDR in bn
12/09
12/10
12/11
NII
15,965
19,537
21,796
Net Profit
7,198
9,369
12,696
EPS Adjusted
336
432
529
DPS
117
138
105
Revenue Grow th
13%
22%
12%
EPS Grow th
34%
29%
23%
ROCE
22
24
24
ROE
13
16
16
P/E (x)
14
15
13
P/BV (x)
3
4
3
Dividend Yield
3
2
2
Source: Bloomberg, Sinarmas Investment Research
Please see important disclaimer and disclosure at the end of the document
12/12
27,531
16,044
664
199
26%
25%
23
16
12
3
2
12/13
32,777
18,830
780
19%
17%
22
16
10
2
February 17, 2014
Bank Mandiri
Sector Comparisons
Ticker
Mkt Cap (B)
P/E Ratio
PBV
CAR
LDR
YTD Return
BMRI IJ
210,583
11.6
2.4
15.0
86
15%
BBRI IJ
215,238
10.1
2.7
17.1
88
20%
BBCA IJ
255,796
18.5
4.2
15.8
71
8%
BBNI IJ
81,681
9.6
1.8
16.8
79
11%
BDMN IJ
44,041
10.9
1.4
18.3
124
22%
Source: Bloomberg, Sinarmas Investment Research
Stock Price versus Peers and Benchmark
YTD Rolling PE and PBV
120
16.0
110
14.0
100
3.5
3.0
12.0
90
2.5
10.0
80
2.0
8.0
70
Rolling PE
JCI
Source: Bloomberg
Jan-14
Dec-13
Nov-13
Oct-13
Sep-13
Peer Index
Aug-13
BANK MANDIRI PERSERO TBK PT
Jul-13
1.0
Jun-13
4.0
Apr-13
Nov-13
May-13
Aug-13
1.5
Mar-13
May-13
6.0
Feb-13
60
Feb-13
Rolling PBV
Source: Bloomberg
Kinerja Keuangan FY2013 (IDR bn)
LAPORAN LABA RUGI
Penempatan Bunga - Bersih
Total pendapatan operasional lainnya
Total beban operasional
Penyisihan
Laba Operasional
Laba Bersih
NERACA
Kredit
Total Simpanan Nasabah
Ekuitas
RASIO KEUANGAN
CAR
LDR
NIM
NPL (Gross)
ROE
Biaya/pendapatan
12M2012 12M2013
27,531
11,897
-18,913
-3,392
19,625
16,044
32,777
14,686
-21,501
-4,856
23,552
18,830
12M2012 12M2013
388,830
482,914
75,756
472,435
556,342
88,791
12M2012 12M2013
15.48%
80.11%
5.70%
1.87%
22.55%
45.11%
14.93%
84.46%
6.10%
1.90%
22.23%
43.08%
Y-o-Y
19%
23%
14%
43%
20%
17%
Y-o-Y
21.5%
15%
17%
Y-o-Y
-0.55%
4.35%
0.40%
0.03%
-0.32%
-2.02%
Source: Bloomberg, Company data, Sinarmas Sekuritas Research
2
4Q2012
7,569
3,396
-5,887
-597
5,253
4,525
4Q2012
388,830
482,914
75,756
4Q2012
15.48%
80.11%
5.70%
1.87%
22.55%
45.11%
4Q2013
9,359
4,178
-6,309
-851
6,980
5,560
4Q2013
472,435
556,342
88,791
4Q2013
14.93%
84.46%
6.10%
1.90%
22.23%
43.08%
Y-o-Y
24%
23%
7%
43%
33%
23%
Y-o-Y
22%
15%
17%
Y-o-Y
-0.55%
4.35%
0.40%
0.03%
-0.32%
-2.02%
3Q2013
8,280
3,912
-5,483
-1,494
5,807
4,661
3Q2013
413,263
514,221
83,742
3Q2013
15.14%
87.26%
5.70%
1.90%
21.35%
42.47%
4Q2013
9,359
4,178
-6,309
-851
6,980
5,560
4Q2013
472,435
556,342
88,791
4Q2013
14.93%
84.46%
6.10%
1.90%
22.23%
43.08%
Q-o-Q
13%
7%
15%
-43%
20%
19%
Q-o-Q
14%
8%
6%
Q-o-Q
-0.21%
-2.80%
0.40%
0.00%
0.88%
0.61%
BANK MANDIRI
FLASH NOTE
DISCLAIMER
This report has been prepared by PT Sinarmas Sekuritas, an affiliate of Sinarmas Group.
This material is: (i) created based on information that we consider reliable, but we do not represent that it is accurate or
complete, and it should not be relied upon as such; (ii) for your private information, and we are not soliciting any action
based upon it; (iii) not to be construed as an offer to sell or a solicitation of an offer to buy any security.
Opinions expressed are current opinions as of original publication date appearing on this material and the information,
including the opinions contained herein, is subjected to change without notice. The analysis contained herein is based on
numerous assumptions. Different assumptions could result in materially different results. The analyst(s) responsible for the
preparation of this publication may interact with trading desk personnel, sales personnel and other constituencies for the
purpose of gathering, integrating and interpreting market information. Research will initiate, update and cease coverage
solely at the discretion of Sinarmas Research department. If and as applicable, Sinarmas Sekuritas’ investment banking
relationships, investment banking and non-investment banking compensation and securities ownership, if any, are specified
in disclaimers and related disclosures in this report. In addition, other members of Sinarmas Group may from time to time
perform investment banking or other services (including acting as advisor, manager or lender) for, or solicit investment
banking or other business from companies under our research coverage. Further, the Sinarmas Group, and/or its officers,
directors and employees, including persons, without limitation, involved in the preparation or issuance of this material may,
to the extent permitted by law and/or regulation, have long or short positions in, and buy or sell, the securities (including
ownership by Sinarmas Group), or derivatives (including options) thereof, of companies under our coverage, or related
securities or derivatives. In addition, the Sinarmas Group, including Sinarmas Sekuritas, may act as market maker and
principal, willing to buy and sell certain of the securities of companies under our coverage. Further, the Sinarmas Group may
buy and sell certain of the securities of companies under our coverage, as agent for its clients.
Investors should consider this report as only a single factor in making their investment decision and, as such, the report
should not be viewed as identifying or suggesting all risks, direct or indirect, that may be associated with any investment
decision. Recipients should not regard this report as substitute for exercise of their own judgment. Past performance is not
necessarily a guide to future performance. The value of any investments may go down as well as up and you may not get
back the full amount invested.
Sinarmas Sekuritas specifically prohibits the redistribution of this material in whole or in part without the written permission
of Sinarmas Sekuritas and Sinarmas Sekuritas accepts no liability whatsoever for the actions of third parties in this respect. If
publication has been distributed by electronic transmission, such as e-mail, then such transmission cannot be guaranteed to
be secure or error-free as information could be intercepted, corrupted, lost, destroyed, arrive late or incomplete, or contain
viruses. The sender therefore does not accept liability for any errors or omissions in the contents of this publication, which
may arise as a result of electronic transmission. If verification is required, please request a hard-copy version.
Additional information is available upon request.
Images may depict objects or elements which are protected by third party copyright, trademarks and other intellectual
properties.
©Sinarmas Sekuritas(2013). All rights reserved.
3

