Reliability and validity of the willingness to communicate scale
advertisement
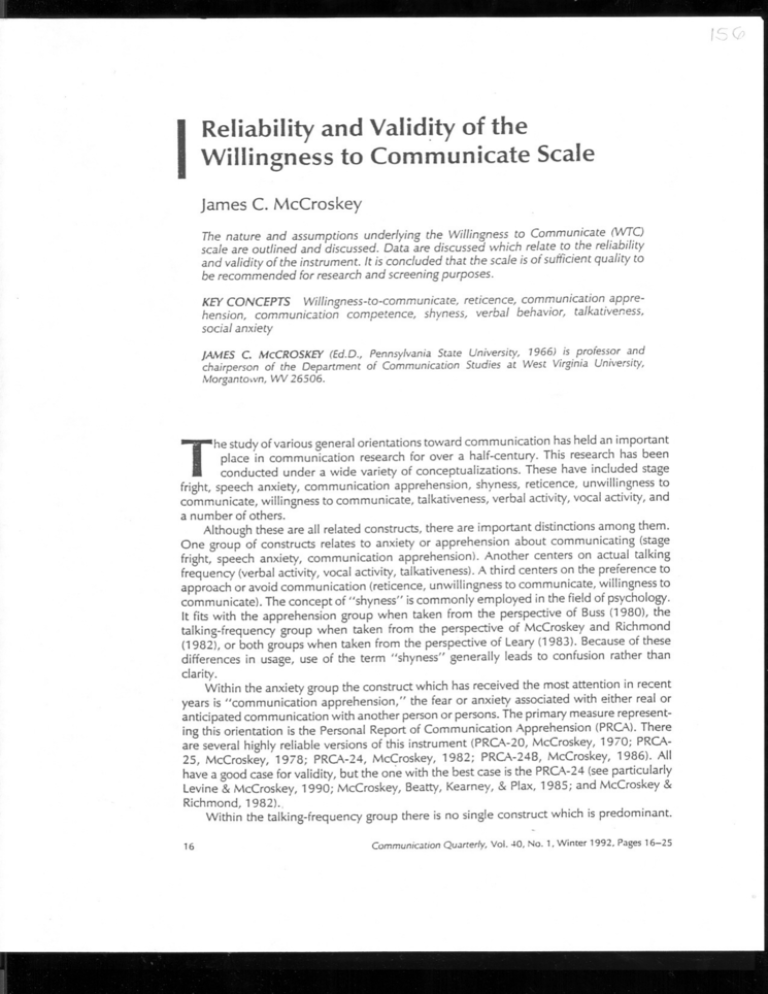
/5 (? Reliability and Valid~ty of the I Willingness to Communicate Scale James C. McCroskey The nature and assumptions underlying the Willingness to Communicate (\AITC) scale are outlined and discussed. Data are discussed which relate to the reliability and validity of the instrument. It is concluded that the scale is of sufficient quality to be recommended for research and screening purposes. KEY CONCEPTS Willingness-to-communicate, reticence, communication apprehension, communication competence, shyness, verbal behavior, talkativeness, social anxiety JAMES C. McCROSKEY(Ed.D., PennsylvaniaState University, 1966) is professor and chairperson of the Department of Communication Studies at West VirginiaUniversity, Morgantown,WV26506. T he study of various general orientations toward communication has held an important place in communication research for over a half-century. This research has been conducted under a wide variety of conceptualizations. These have included stage fright, speech anxiety, communication apprehension, shyness, reticence, unwillingness to communicate, willingness to communicate, talkativeness, verbal activity, vocal activity, and a number of others. Although these are all related constructs, there are important distinctions among them. One group of constructs relates to anxiety or apprehension about communicating (stage fright, speech anxiety, communication apprehension). Another centers on actual talking frequency (verbal activity, vocal activity, talkativeness). A third centers on the preference to approach or avoid communication (reticence, unwillingness to communicate, willingness to communicate). The concept of "shyness" is commonly employed in the field of psychology. It fits with the apprehension group when taken from the perspective of Buss (1980L the talking-frequency group when taken from the perspective of McCroskey and Richmond (1982), or both groups when taken from the perspective of Leary (1983). Because of these differences in usage, use of the term "shyness" generally leads to confusion rather than clarity. Within the anxiety group the construct which has received the most attention in recent years is "communication apprehension/' the fear or anxiety associated with either real or anticipated communication with another person or persons. The primary measure representing this orientation is the Personal Report of Communication Apprehension (PRCA).There are several highly reliable versions of this instrument (PRCA.-20, McCroskey, 1970; PRCA25, McCroskey, 1978; PRCA-24, McCroskey, 1982; PRCA-24B, McCroskey, 1986). All have a good case for validity, but the on"ewith the best case is the PRCA-24 (see particularly Levine & McCroskey, 1990; McCroskey, Beatty, Kearney, & Plax, 1985; and McCroskey & Richmond, 1982)., Within the talking-frequency group there is no single construct which is predominant. 16 Communication Quarterly, Vol. 40, No.1, Winter 1992, Pages 16-25 In some cases the research has approached this area as a set of behaviors which are observable by others. In other cases the research has approached it as a report from an individual with regard to her/his own behavior. One measure has been used reliably for both purposes, has a fairly strong indication of validity, but has been reported under two different names. It was originally reported under the name "Verbal Activity Scale" (VAS: McCroskey, 1977). Later, as the scale was studied more intensively, it was referred to as the "Shyness Scale" (55: McCroskey, Andersen, Richmond, & Wheeless, 1981; McCroskey & Richmond, 1982). Within the approach-avoidance group, the reticence construct was the first advanced (Phillips, 1968). The Burgoon (1976) conceptualization of "unwillingness to communicate," however, was a much more fully developed conceptualization of an overall orientation toward communication. Unfortunately, the measure developed for the construct turned out to have two dimensions, neither of which were isomorphic with the conceptualization and one of which clearly was a measure of communication apprehension. The most recent conceptualization in this area, named "willingness to communicate" (McCroskey & Richmond, 1985), is essentially the same as the earlier "unwillingness" construct but is worded in the positive rather than the negative direction. More importantly, the measure for the newer conceptualization appears to be a valid measure of the construct. It is the "Willingness-To-Communicate" scale (WTC: McCroskey & Richmond, 1985; 1987). The purpose of the present paper is to analyze the available data related to the reliability and validity of that instrument. Nature of the Instrument The WTC scale (see Figure 1) is a 20-item, probability-estimate scale. Eight of the items are fillers and 12 are scored as part of the scale. When scored as indicated in Figure 1, it yields a total score, three subscores based on types of receivers (strangers, acquaintances, friends), and four subscores based on types of communication contexts (public, meeting, group, dyad). The scale was designed as a direct measure of the respondent's predisposition toward approaching or avoiding the initiation of communication. This is in contrast to methods which might seek to tap into feelings of introversion, apprehension, alienation, self-concept or other such orientations which are believed to be associated with approaching or avoiding communication. The indirect approach was not successful in generating an appropriate scale in earlier research efforts.1 Use of the direct approach assumes the respondent is generally aware of her/his own approach/avoidance tendencies. Early work with the instrument indicated college student subjects had little difficulty with the instrument and found it simple to fillout, suggesting that the awareness assumption is a valid one. Later use of the instrument, with younger children and with people whose first language was one other than English, indicated additional explanation of the probability scale concept was needed. Once that was understood, these respondents also were able to handle the scale with ease. The 12 items on the scale represent the crossing of three types of receivers with four types of communication context. While neither the receiver nor the context categories were presumed to be exhaustive, they were assumed to be broadly representative. The test of this assumption, of course, is to measure orientations toward another type of receiver or type of context and correlate that score with the overall WTC score. In a study reported by Chan (1988) the correlation of the total WTC score with a score on an instrument she developed to measure college student respondents' willingness to communicate in a classroom context was .70 (.80 corrected for attenuation). In a study involving college professors as Reliability and Validity of the Willingness to Communicate Scale li Willingness to Communicate Scale (WTCJ DIRECTIONS: Below are twenty situations in which a person might choose to communicate or not to communicate. Presume you havecompletely free choice. Indicate the percentage of times you would choose to communicate in each type of situation. Indicate in the space at the left what percent of the time you would choose to communicate. 0 = never, 100 = always 1. *Talk with a service station attendant. 2. *Talk with a physician. 3. Present a talk to a group of strangers. 4. Talk with an acquaintance while standing in line. 5. *Talk with a salesperson in a store. 6. Talk in a large meeting of freinds. 7. *Talk with a police officer. 8. Talk in a small group of strangers. 9. Talk with a friend while standing in line. 10. *Talk with a waiter/waitress in a restaurant. 11. Talk in a large meeting of acquaintances. 12. Talk with a stranger while standing in line. 1:' *Talk with a secretary. 14. Present a talk to a group of friends. 15. Talk in a small group of acquaintances. 16. *TaIkwith a garbage collector. 17. Talk in a large meeting of strangers. 18. *Talk with a spouse (or girl/boy friend). 19. Talk in a small group of friends. 20. Present a talk to a group of acquaintances. *Filler item SCORING: The WTC permits computation of one total score and seven subscores. The subscores relate to willingness to communicate in each of four common communication contexts and with three types of audiences. To compute your scores, merely add your scores for each item and divide by the number indicated be/ow. Subscore Desired Scoring Formula Group discussion Add scores for items 8,15, and 19; then divide by 3. Meetings Add scores for items 6, 11, and 17; then divide by 3. Interpersonal conversations Add scores for items 4,9, and 12; then divide by 3. Public speaking Add scores for items 3, 14, and 20; then divide by 3. Stranger Add scores for items 3, 8, 12, and 17; then divide by 4. Acquaintance Add scores for items 4, 11, 15, and 20; then divide by 4. Friend Add scores for items 6, 9, 14, and 19; then divide by 4. To compute the total WTC scores, add the subscores for stranger,acquaintance, and friend. Then divideby 3. . FIGURE1 respondents Combs (1990) observed similarly high association between the total WTC scores and the scores on an instrument she developed to measure willingness to communicate with a special type of audience, authority figures (department chairs and higher university administrators). Both of these studies point to the acceptability of the representativeness assumption underlying the 12 items on the scale. The need for a representative sample of receiver/context items is important for establishing meaningful norms for the instrument. It is very reasonable to assume that people will be more willing to communicate with some kinds of receivers than with some 18 McCroskey other kinds and will be more willing to communicate in some contexts than in some other contexts. In general. for example, we might expect most people would be more willing to communicate with friends in a dyadic context than to communicate with a group of strangers in a public speaking context. However, if the measure is to be an appropriate measure or a general willingness-to-communicate predisposition, even though the score on anyone such receiver/context item might be very different from the score on another item, any given item should be substantially correlated with the other items. This concern is addressed in more detail in following sections concerning reliability and validity. Normative Data At the time of this writing, no definitive norms based on a representative national sample of the population are available. The largest sample studied to this time was a sample of 1641 students at West Virginia University. Data on other communication measures obtained from other samples of this student body have proven to be very similar to norms generated from more demonstrably representative college student samples (Andersen, Lustig, & Andersen, 1990). The data obtained from a national study of college students from over 50 schools of pharmacy (over 10,000 respondents) utilizing the Personal Report of Communication Apprehension (PRCA-24) yielded a normative mean for that instrument of 65.2 which was very similar to the norm of 65.6 which was generated from data from over 12,000 WVU student respondents (McCroskey, Fayer, & Richmond, 1985). A North American sample of over 1,800 chiropractic assistants yielded a mean on the same instrument which was even closer to the WVU mean, 65.4 (Allen, Richmond, & McCroskey, 1984). In the absence of contrary information, therefore, it is not unreasonable to assume that norms based on this group of respondents may be representative of both college students nationally and non-college adults working in relatively unskilled occupations. The normative data based on the WVU students is reported in Table 1. Not surprisingly, the data indicate that the respondents are least willing to communicate in a public speaking context and with strangers while they are most willing to communicate with friends and in dyads. Data obtained from college students living in a variety of other cultures around the world are included in Table 2 for comparative purposes. An examination of the means from the various cultures indicates that not only are the means different but even the ordering is different for the various contexts from culture to culture. Hence, it is very important to recognize that whatever is "normal" is highly culturally dependent. TABLE 1 Normative Means, Standard Deviations, and Reliabilities for WTC Scores WTCScore TotalWTCScore Context Subscores Public Meeting Group Dyad Receiver subscores Stranger Acquaintance Friend ,"'ean 65.2 S.D. 15.1 Reliability 54.2 59.7 70.8 76.2 21.3 19.9 16.3 15.6 .74 .70 .65 .68 38.5 72.5 84.7 21.5 18.3 14.0 .84 .79 .76 Reliabilityand Validity of the Willingnessto CommunicJte SCJ/e .92 19 TABLE 2 Comparative Means of College Students From Various Countries WTC Score Total WTC Score Context Subscores Public Meeting Group Dvad Receiver Subscores Stranger Acquaintance Friend U.S. Sweden Australia .56.6 ,'vficronesia Finland Estonia 47.3 54.6 54.8 65.2 58.1 54.2 59.7 70.8 76.2 53.3 52.2 63.3 63.3 46.0 53.1 63.3 63.8 47.0 37.4 55.2 49.6 51.8 49.4 59.8 72.9 53.6 51.5 61.8 51.9 38.5 72.5 84.7 37.4 62.8 73.8 38.8 61.0 75.9 22.9 44.4 74.5 35.1 60.7 68.1 38.5 63.3 62.2 Reliability Estimates Although reliability of a scale is no guarantee of validity, without it a scale has no value at all. Allof the availabledata indicate.the \NTC scale is highlyreliable. Studiesconducted by this writer in conjunction with various colleagues have found the estimates of internal reliability of the total score on the instrument to range from .86 to .95 with a modal estimate of .92. Estimates generated from data collected in other cultures have been consistent with those obtained in the U.S. As a function of the smaller number of items, reliability estimates for the subscores are somewhat lower and more variable than those for the total scale. Estimates reported in Table 1 are taken from the large WVU sample. Obtained estimates for the context subscores have ranged from .60 to .83. Those for the receiver subscores have ranged from .70 to .91. Again, data from other cultures have generated reliability estimates very similar to those obtained from the U.S. data. The only test-retest reliability estimate obtained to this point was based on a sample of 174 WVU students who were asked to complete the WTC twice with an approximate three-month interval between administrations. The obtained correlation between the scores at the two times was .79. The internal reliability estimates for the two administrations were .92 and .91, respectively. Hence, the test-retest reliability estimate corrected for attenuation due to internal unreliability is .86. Based on the above reliability estimates, it appears the WTC scale has very satisfactory stability. It is presumed to measure a stable trait of an individual, so such stability is critical to the validity of the instrument. Validity Content Validity.The first test of the validity of any self-report scale is face validity. Does it appear, on its face, to measure the construct which it purports to measure? The construct relates to a person's predispositional preferences with regard to communication. Does the person generally prefer to approach or withdraw from communication opportunities? When one is directly confronted with another person attempting to initiate communication, such a preference would not be presumed to be the primary predictor of behavior. Rather, common courtesy might cause even a very reluctant person to respond with communication when it is initiated by another. Thus, a measure of one's predisposition to communicate must focus on circumstances where the person has free choice to initiate or avoid communication. The WTC specifically directs the respondent to complete the scale with this aspect of free choice in mind. 20 McCroskey The response format of a self-report scale also is important to the content validity of the scale. The use of the 0-100 probability response format was chosen over an agree-disagree type format because it allows the respondent to use a response system common to most individuals from elementary school on. It is used, for example, as the measure of success in many instructional systems and commonly used to indicate weather patterns in news reports. Simply put, it is an estimation system commonly understood by lay people. As was noted previously, the items on the instrument were developed by crossing three common types of receivers with four common communication contexts to yield 12 items believed to represent a cross-section of communication situations with which an individual might come in contact. The resulting items do appear to be broadly representative. While "eye-balling" such as the above cannot determine the dimensionality of an instrument, it was assumed that the scale would be unidimensional. That is, even though a person's responses to different items might vary substantially, it was assumed the responses would be highly correlated with each other. If dimensions appeared as a function of receiver type or ot context type, for example, the measurement of a larger overall system would come into question, since that system would need to be established through an hierarchical analysis. In the first empirical test of the measure (McCroskey & Baer, 1985) a factor analysis indicated the assumption of unidimensionality was acceptable. All of the items on th" measure had their highest loadings on the first unrotated factor, indicating they were all highly associated with a single underlying factor. Additionally, no interpretable multidimensional structure could be obtained through forced rotations of 2-7 factors. In sum, the preliminary examinations of the WTC indicated its underlying assumptions' were tenable. Its content validity appears to be satisfactory. Construct Validity. It is entirely possible for a scale to measure something very well but that "something" may not represent the construct which it was designed to measure. Hence, establishing construct validity of a scale is particularly important. The theoretical foundation of the WTC construct is presented in detail elsewhere (McCroskey & Richmond, 1985; 1987) so this formulation will not be duplicated here. Suffice to say,the construct is that of an orientation toward communication which we have referred to previously as a predisposition to approach or avoid communication. It specifically is posited to be associated with constructs relating to apprehension or anxiety about communication as well as constructs associated with a behavioral tendency regarding talking frequency. However, the underlying construct is not presumed to be isomorphic with the latter constructs. In short, moderate correlations (close to or above .40) could be expected between these constructs and the WTC scale but very high correlations (substantially above .60) would indicate a relationship stronger than theoretically justified and could indicate measurement overlap or lack of conceptual distinctiveness. Employing the Verbal Activity Scale (McCroskey, 1977; also known as the Shyness Scale, McCroskey & Richmond, 1982) as the self-report of talking frequency and the Personal Report of Communication Apprehension (PRCA-24: McCroskey, 1982) as the measure of apprehension about communication, the relationships between the WTC and the measures of these constructs were examined (McCroskey & Baer, 1985). The results indicated a correlation between the VAS and the WTC of .41 and one between the PRCA-24 and the WTC of -.52. A subsequent study employing another version of the PRCA obtained a correlation of - .50 (McCroskey & McCroskey, 1986a). These results provide strong support for the construct validity of the WTC The writings of Burgoon (1976), Phillips (1984), and McCroskey and Richmond (1987) point to a variety of variables which are believed to be causally related to an individual's predispositions toward approaching or avoiding communication. These include self-esteem, Reliability and Validity or"the Willingness to Communicate Scale 21 anomie, alienation, introversion, and communication competence. Subsequent research (McCroskey & McCroskey, 1986a, 1986b) observed modest but statistically significant correlations between WTC scores and self-esteem (.22), anomie (- .14), alienation (-.17), and introversion (- .29) but a much more substantial correlation with self-perceived communication competence (.59). The former correlations are consistent with the theoretical positions of the writers cited above. The latter one, relating to competence, is consistent with the very strong position taken by Phillips regarding the central role of one's communication competence in determining her/his tendency to approach or avoid communication (in his terms, to be reticent or not). Other research in other cultures (McCroskey & Richmond, 1990) has found correlations similar to those reported above for the relationships between the WTC and measures of communication apprehension and communication competence. This suggests at least some construct validity for the 'vVTCscale in cultures other than the specific one in which the construct was formulated. One anomaly, however indicates the difficulty of cross-cultural generalization. The obtained correlation between the 'vVTCand self-perceived competence in J'vlicronesiawas extremely high (.80). In that culture competence and willingness appear to be almost isomorphic constructs. This may be a function of the fact that the students who complet"d the instrument in that study were from a wide variety of islands and consequently had a wide variety of first languages. Much of their communication, therefore, has to be in a second language. It is quite probable that they equated communication competence with second language competence without which one would be unable to communicate at all in many cases. In any event, the observed correlations between scores on the WTC and those on a variety of other self-report scales are generally very supportive of the construct validity of the scale. Most importantly, the correlations indicate that what is measured by the WTC is distinct from what is measured by the scales designed to measure communication apprehension or talking behavior. Thus, the tripartite conceptual distinction between apprehension, willingness, and talkativeness advanced at the outset of this paper clearly is supported by the available data. These data point to the construct validity of all three of the measures of these constructs, not just that of the WTC scale. Predictive Validity. The final! type of validity, predictive validity, is considered by many to be the most critical test of all. In the case of the WTC it certainly is reasonable to expect that scores on the measure will be at least to some degree associated with real communication behavior. We expect predispositions to be associated with behaviors, for if they universally were not it is questionable whether we would be interested in those predispositions at all. It is important, however, that we not expect any given predisposition to be perfectly related to any given behavior. What one chooses to do in a given circumstance may be in conflict with one predisposition while at the same time be consistent with another. Individual behaviors are subject to the influence of many factors, not just single predispositions. However, over a substantial number of people, or over a substantial number of behaviors, it is reasonable to expect a predispositional measure to be at least partially predictive of behavioral outcomes. Two studies have directly addressed the issue of the predictive validity of the WTC. In the first study (Chan & McCroskey, 1987) students in three college classes (one each in philosophy, mathematics, and geography) completed the WTC during the first class day of the course. Students were identified who scored one standard deviation above or below the mean on the 'vVTCas "high" or "low" in willingness to communicate. Students in between the extremes were not studied beyond this point. It was hypothesized that more students 22 McCroskey who were in the "high" category would participate in classroom interaction than would those classified as "low" and that more total participation in the classrooms would involve students from the "high" category than from the "low" category. The classes were observed on three occasions: once early in the term, once near the middle of the term, and once near the end of the term. The results supported both hypotheses. Proportionately more high-willing students than low-willing students participated at each observation time and their participation accounted for proportionately more of the total classroom participation. The second study (Zakahi & McCroskey, 1989) examined willingness to communicate as a potential cause of a problem commonly experienced by researchers who depend on the voluntary participation of students (or other types of people) who must appear for participation at a place other than their normal classroom (or place of employment). The problem was that of the "no show." A total of 381 students were screened for participation in a research project. The class in which they were enrolled was a lecture course which did not require any oral performance from any student nor did it have a research participation requirement. As potential subjects the students were asked to sign an informed consent form consenting to participate in the first phase of the study (complete the WTC scale) and be contacted to participate in the second phase of the study later. All of the students agreed to be potential subjects ar j completed the consent form and WTC scale. No students were contacted again until the next semester. Students were categorized into high and low categories in the same manner as in the Chan and McCroskey (1987) study. However, only 25 subjects were chosen from each of the extreme groups for further study. These were chosen randomly and were replaced in the same manner if they could not be contacted (no longer in the u,niversity, phone disconnected and no new number). Subjects were contacted by a naive confederate who was blind to both the purpose of the study and what category a student was in. Subjects were told their participation would involve completion of a couple of questionnaires and being interviewed by the researcher. They were assured their participation was very important and no more than twenty minutes of their time would be required. They were given no other inducements, academic or financial. Students who refused to participate were thanked, recorded as refusals, and not contacted again. Of those who were contacted, 92 percent (23) of the high willing-tocommunicate group agreed to participate, but only 68 percent (17) of the low willing-tocommunicate agreed to do so. Statistically, this difference was very significant (p. < .0001). Individuals who reported to the study as scheduled (rescheduling was possible if conflicts arose) were recorded as participants and not contacted again. Thirteen (52%) of the high willing to communicate group reported for the study as initially scheduled but only six (24%) of the low willing to communicate group did so. Again, statistically this difference was very significant (p. < .001). Thus, of the original 50 subjects contacted, 38% appeared for the study as scheduled, but it was twice as likely that a high WTC subject would appear as it was that a low WTC subject would appear. The researchers' confederate in this study was very persistent in attempting to get the "no shows" to come to the study. These individuals were recontacted for rescheduling. If they appeared as rescheduled, they were placed in a "participated later" group. If they did not, they were contacted for rescheduling again and again. This process continued for 23 days. Only one subject (a low-willing) expressed irritation at being recontacted. No further contact was made with that subject. Ultimately, 21 (84%) of the high willing-tocommunicate subjects actually participated in the final phase of the study. In contrast only Reliability and Validity of the Willingness to Communicate Scale 23 13 (52%) of the low willing to communicate subjects did so. Statistically, this difference is very significant (p. < .0001). While the above study was conducted in an effort to identify one of the reasons why people may be no-shows for communication research and the problems that may be caused for the generalizability of such research as a result, it provided a very interesting test of the predictive validity of the WTC. As it turned out, the scores on the scale were able to predict initial agreement to attend a situation where communication .(an interview) would be required, actual attendance at such a situation, and resistence to participation even after very persistent efforts to gain such attendance. In sum, these studies point to a potent predictive ability of the WTC scale. The situations employed were distinctly different communication events than those identified in any of the items on the scale. Hence, the general predictability of the scale was demonstrated to be strong, not just the ability to predict situations specifically represented on the scale itself. Given the demonstrated reliability and validity of the Willingness to Communicate scale, it is reasonable to recommend it for future use as a research or screening tool. It meets the usual tests for acceptability of such a measure. FOOTNOTES 'For an example of this approach, see Burgoon (1976). These comments should not be taken as a negative evaluation of her work. The approach she followed was entirely consistent with measurement approaches being employed at the time she conducted her research. In addition, she consulted with and was advised by this writer at the time! 2Concurrent validity will not be considered since it is tested by comparing a new scale with a previously validated scale designed to measure the same thing. There is no such scale available. REFERENCES Allen, j., Richmond, V. P., & McCroskey, j. C. (198-1-).Communication and the Chiropractic profession: PartI.Journal of Chiropractic, 27, No.9, 24-30. Andersen, P.A., Lustig,M. W., & Andersen,j. F. (1990). Changesin latitude, changesin attitude: The relationship between climate and interpersonal communication predispositions.Communication Quarterly, 38, 291-311. Barraclough, R. A., Christophel, D. M., & McCroskey, j. C. (1988), Willingness to communicate: A cross-cultural investigation. Communication Research Reports, 5, 187-192. Burgoon, j. K. (1976). The unwillingness-to-communicate scale: Development and validation. Communication Monographs, 43/ 60-69. Burroughs, N. F., & Marie, V. (1990). Communication orientations of Micronesian and American students. Communication ResearchReports, 7, 139-146. Buss, A. H. (1980). Self-consciousness and social anxiety. San Francisco: W. H. Freeman and Company. Chan, M. B. (1988). The effects of willingness to communicate on student learning. Doctoral dissertation,West Virginia University, Morgantown, WV. Chan, B., & McCroskey, j. C. (1987). The WTC scale as a predictor of classroom participation. Communication Research Reports, 4, 47-50. Combs, M. j. (1990). Willingness to communicate: An investigation of instrument applicability to authority target types. M. A. Thesis,Ball StateUniversity, Muncie, IN. Leary, M. R. (1983). Understanding social anxiety: Social personality, and clinicalperspectives. Beverly Hills, CA: Sage. Levine,T. R., & McCroskey,j. C. (1990). Measuringtrait communication apprehension: A testof rival measurementmodels of the PRCA-Z4.Communication Monographs, 57/ 62-72. McCroskey, j. C. (1970). Measures of communication-bound anxiety. Speech Monographs, 37, 269-277. McCroskey,j. C. (1977). Quiet children and the classroom teacher. Falls Church, VA: Speech Communication Association. 24 McCroskey McCroskey, J. C (1978). Validity of the PRCAas an index of oral communication apprehension. Communication Monographs, 45,192-203. McCroskey, J. C (1982), An introduction to rhetorical communication, 4th ed. Englewood Cliffs, NJ: Prentice-Hall. McCroskey, J. C (1986), An introduction to rhetorical communication, 5th ed. Englewood Cliffs, NJ: Prentice-Hall. McCroskey,j. C, & Baer,J. E.(November, 1985). Willingnessto communicate: The construct and its measurement. Paper presented at the Speech Communication Association convention, Denver, CO. . McCroskey,j. C, & McCroskey,L. L.(February, 1986a). Correlates of willingness to communicate. Paperpresentedat the Western SpeechCommunication Association,Tucson,AZ. McCroskey, J. C, & McCroskey, L. L.. (November, 1966b). Communication competence and willingness to communicate. Paper presented at the Speech Communication Association, Chicago. IL. McCroskey,J. C, & Richmond,V. P.(1982).Communication apprehension and shyness:Conceptual and operational distinctions.CentralStatesSpeechJournal, 33, 458-468. McCroskey, J. C, & Richmond, V. P. (March, 1985). Willingness to communicate and interpersonal communication. Paper presented at the West Virginia Symposium on Personality and Interpersonal Communication,Morgantown,'vW. McCroskey, j. C, & Richmond, V. P.(1987).Willingness to Communicate. In j. C McCroskey and J. A Daly, Personality and interpersonal communication, Newbury Park, CA: Sage, pp. 129-156. McCroskey, j. C, & Richmond, V. P. (1990). Willingness to communicate: Differing cU:.ural perspectives. Southern Communication Journal, 56, 72-77. McCroskey, J. C, Fayer, J., & Richmond, V. P. (1985). Don't speak to me in English: Communication Apprehension in Puerto Rico. Communication Quarterly, 33, 185-192. McCroskey,J. C, Andersen, j. F., Richmond, V. P., & Wheeless, L. R. (1981). Communication Apprehension of Elementary and Secondary Students and Teachers. Communication Education, 30, 122-132. McCroskey, j. C, Beatty, IV\.J., Kearney, P., & Plax,T. G. (1985). The content validity of the PRCA-24 as a measure of communication apprehension across communication contexts. Communication Quarterly, 33, 165-173. McCroskey, j. C. Burroughs, N. F., Daun, A, & Richmond, V. P. (1990). Correlates of Quietness: Swedish and American Perspectives. Communication Quarterly, 38,127-137. Phillips. G. M. (1968). Reticence: Pathology of the normal speaker. Speech Monographs, 35, 39-49. Phillips, G. M. (1984). Reticence: A perspective on social withdrawal. In j. A Daly and j. C McCroskey, Avoiding communication: Shyness, reticence, and communication apprehension. Beverly Hills, CA: Sage,pp. 51-66. Sallinen-Kuparinen, A., McCroskey, j. C, & Richmond, V. P. (1991). Willingness to communicate, communication apprehension, introversion, and self-reported communication competence: Finnishand ,-\mericancomparisons. Paper presented at the World Communication.-\ssociation convention, Jyvaskyla, Finland. . Zakahi, W. R. & McCroskey,j. C (1989). Willingness to communicate: A potential confounding variable in communication research. Communication Reports, 2, 96-104. Reliability and Validity of (he Willingness to Communicate Scale 25
