Case Study - No Magic, Inc
advertisement
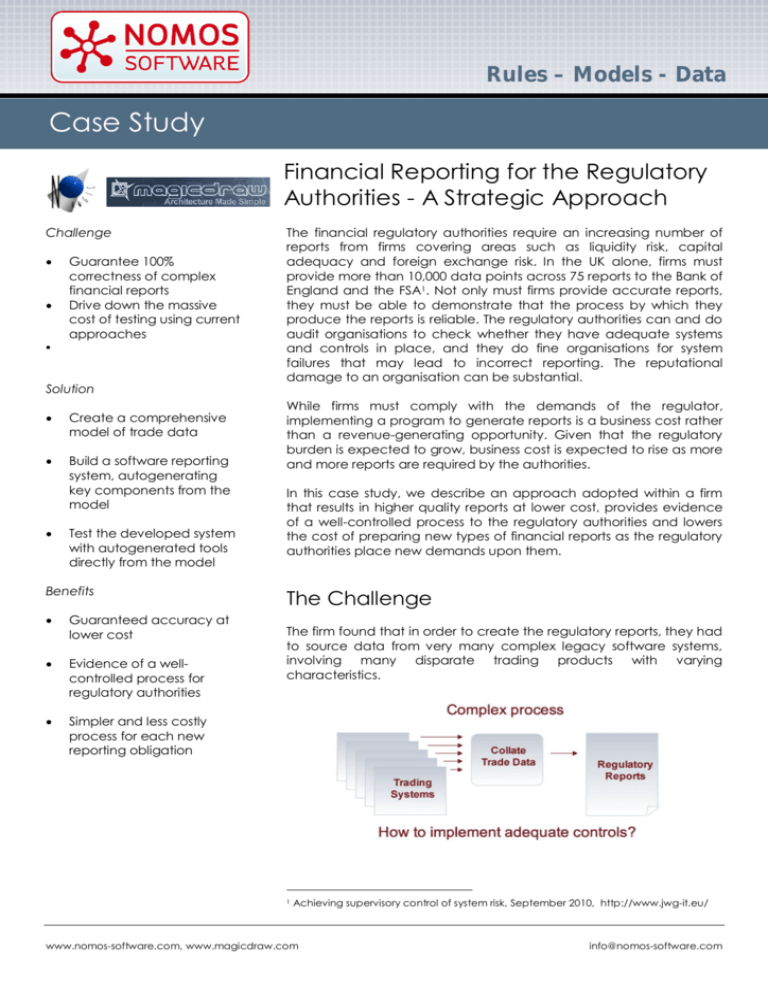
Rules – Models - Data Case Study Financial Reporting for the Regulatory Authorities - A Strategic Approach Challenge Guarantee 100% correctness of complex financial reports Drive down the massive cost of testing using current approaches The financial regulatory authorities require an increasing number of reports from firms covering areas such as liquidity risk, capital adequacy and foreign exchange risk. In the UK alone, firms must provide more than 10,000 data points across 75 reports to the Bank of England and the FSA1. Not only must firms provide accurate reports, they must be able to demonstrate that the process by which they produce the reports is reliable. The regulatory authorities can and do audit organisations to check whether they have adequate systems and controls in place, and they do fine organisations for system failures that may lead to incorrect reporting. The reputational damage to an organisation can be substantial. Solution Create a comprehensive model of trade data Build a software reporting system, autogenerating key components from the model Test the developed system with autogenerated tools directly from the model Benefits Guaranteed accuracy at lower cost Evidence of a wellcontrolled process for regulatory authorities Simpler and less costly process for each new reporting obligation While firms must comply with the demands of the regulator, implementing a program to generate reports is a business cost rather than a revenue-generating opportunity. Given that the regulatory burden is expected to grow, business cost is expected to rise as more and more reports are required by the authorities. In this case study, we describe an approach adopted within a firm that results in higher quality reports at lower cost, provides evidence of a well-controlled process to the regulatory authorities and lowers the cost of preparing new types of financial reports as the regulatory authorities place new demands upon them. The Challenge The firm found that in order to create the regulatory reports, they had to source data from very many complex legacy software systems, involving many disparate trading products with varying characteristics. 1 Achieving supervisory control of system risk, September 2010, http://www.jwg-it.eu/ www.nomos-software.com, www.magicdraw.com info@nomos-software.com There was significant effort, cost and risk involved in building a system that collated data from such disparate systems. If the firm treated each reporting project independently, they would have to repeatedly manage the same risks, and incur the same costs, with every new project. What was needed was a coordinated and strategic approach to the programme design. The Solution The firm decided to model the data from all of the legacy systems. This model was to be re-used across multiple projects. While data modelling is common practice as a starting point in software projects, the firm decided to harness the information in a new and powerful way: the data model was to be used to autogenerate key components of the production reporting system. The model was also to be iteratively refined and corrected so that it would provide an excellent starting point for subsequent reporting projects. For the first reporting project, the solution involved three, iterative steps: model, build and test (figure 1), while subsequent projects were to make heavy use of the already validated data model from the previous projects (figure 2). Once the systems were well-tested, they would be moved into production. Figure 1: First Reporting Project Figure 2: Process for Subsequent Reporting Projects Step 1: Model The firm needed a comprehensive understanding of the trade data from the legacy systems, so they started with an information modelling exercise. They created a common model for all products and trade shapes. Expert business analysts used the top class modelling environment, MagicDrawTM, which provides a rich, visual environment. It is based on OMG’s2 well-established Unified Modelling Language (UML) standard. The business analysts were able to precisely model the trade data and capture the business rules using Object Constraint Language (OCL), part of the UML standard. They modelled business concepts such as trade, party and counterparty. They modelled relationships between concepts, for example that a trade involves a party and counterparty. Crucially, they modelled the business rules.For example, that the party and counterparty in a standard trade must be different. 2 OMG: Object Management Group, www.omg.org www.nomos-software.com, www.magicdraw.com info@nomos-software.com Step 2: Build The firm then needed to build a reporting system that gathered data as described in the model from the trading systems. It needed to check the correctness of the data, and transform the data into regulatory reports. Given the investment in rigorous information modelling, it was possible to introduce a major innovation. Key components of the software system that checked the correctness of the data were automatically generated from this model. In technical terms, MagicDraw was used to autogenerate an XML schema from the UML trade model. This schema defined the structure in which trade data is passed to the report generation system. The Nomos Software OCL Transformer was used to extract business rules from the model, and to autogenerate a set of executable business rule tests. Step 3: Test The reporting system, including the components autogenerated from the model, were tested using the Nomos rules execution engine during the traditional project test phase. When logic failures in the model and business rules were identified, the model was corrected and the system components were regenerated based. This process, where the model is used to autogenerate system components, is termed model-driven engineering. The growng knowledge of the project team is iteratively incorporated into the model. The validated model from an earlier project can be used with confidence as a starting point for subsequent reporting obligations. With every new iteration less effort is required, not more. In the production system, the autogenerated components are used to ensure that the data from the trading systems is correct according to the latest business rules. When disparate trade data is well-structured according to a common UML model, and rigorously tested based on up-to-date business rules, the report generation step is robust and simple. The Benefits This sound approach to designing and implementing the reporting system resulted in: Guaranteed accuracy of regulatory reports at lower cost. On the ground estimates of cost savings were over 50%, in an environment where testing was traditionally 50% of project cost. Evidence for the regulatory authorities that its systems and controls are adequate, Limited long-term business cost of regulatory reporting as the regulatory burden grows. With thanks to Martin Fogarty, http://ie.linkedin.com/in/martinfogarty and Siobhain Hayden, http://ie.linkedin.com/in/siobhainahayden. For inquiries, contact No Magic, Inc., Phone: +1-214-291-9100 E-mail: sales@magicdraw.com URL: http://www.magicdraw.com E-mail: info@nomos-software.com URL: http://www.nomos-software.com www.nomos-software.com, www.magicdraw.com info@nomos-software.com
