Macroeconomics LESSON 5
advertisement
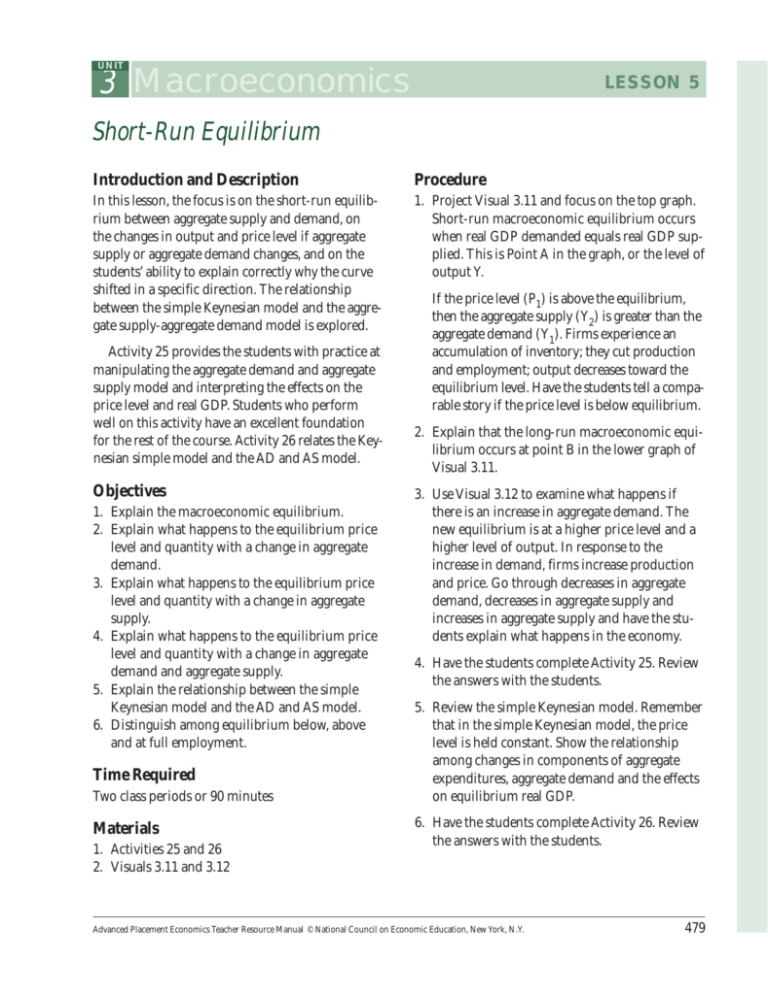
UNIT 3 Macroeconomics LESSON 5 Short-Run Equilibrium Introduction and Description Procedure In this lesson, the focus is on the short-run equilibrium between aggregate supply and demand, on the changes in output and price level if aggregate supply or aggregate demand changes, and on the students’ ability to explain correctly why the curve shifted in a specific direction. The relationship between the simple Keynesian model and the aggregate supply-aggregate demand model is explored. 1. Project Visual 3.11 and focus on the top graph. Short-run macroeconomic equilibrium occurs when real GDP demanded equals real GDP supplied. This is Point A in the graph, or the level of output Y. Activity 25 provides the students with practice at manipulating the aggregate demand and aggregate supply model and interpreting the effects on the price level and real GDP. Students who perform well on this activity have an excellent foundation for the rest of the course. Activity 26 relates the Keynesian simple model and the AD and AS model. Objectives 1. Explain the macroeconomic equilibrium. 2. Explain what happens to the equilibrium price level and quantity with a change in aggregate demand. 3. Explain what happens to the equilibrium price level and quantity with a change in aggregate supply. 4. Explain what happens to the equilibrium price level and quantity with a change in aggregate demand and aggregate supply. 5. Explain the relationship between the simple Keynesian model and the AD and AS model. 6. Distinguish among equilibrium below, above and at full employment. Time Required Two class periods or 90 minutes Materials 1. Activities 25 and 26 2. Visuals 3.11 and 3.12 If the price level (P1) is above the equilibrium, then the aggregate supply (Y2) is greater than the aggregate demand (Y1). Firms experience an accumulation of inventory; they cut production and employment; output decreases toward the equilibrium level. Have the students tell a comparable story if the price level is below equilibrium. 2. Explain that the long-run macroeconomic equilibrium occurs at point B in the lower graph of Visual 3.11. 3. Use Visual 3.12 to examine what happens if there is an increase in aggregate demand. The new equilibrium is at a higher price level and a higher level of output. In response to the increase in demand, firms increase production and price. Go through decreases in aggregate demand, decreases in aggregate supply and increases in aggregate supply and have the students explain what happens in the economy. 4. Have the students complete Activity 25. Review the answers with the students. 5. Review the simple Keynesian model. Remember that in the simple Keynesian model, the price level is held constant. Show the relationship among changes in components of aggregate expenditures, aggregate demand and the effects on equilibrium real GDP. 6. Have the students complete Activity 26. Review the answers with the students. Advanced Placement Economics Teacher Resource Manual © National Council on Economic Education, New York, N.Y. 479 UNIT 3 Macroeconomics LESSON 5 ■ ACTIVITY 25 Answer Key Short-Run Equilibrium Price Level and Output Part A Equilibrium Figure 25.1 PRICE LEVEL Equilibrium Price and Output Levels SRAS P2 P P1 AD Y REAL GDP 1. What are the equilibrium price level and output? ______________ P and Y 2. What would eventually happen to the price level and output if the initial price level were P2 rather than P? Why would this happen? There is excess supply of goods and services. Inventories are building up. To reduce the inventory levels, firms will cut prices and output. The price level will fall, and real output will decrease. This would happen because higher inventories will cause sellers to reduce prices; lower prices will provide fewer incentives to increase production. However, consumers will purchase more output at lower prices. 3. What would eventually happen to the price level and output if the initial price level were P1 rather than P? Why would this happen? There is excess demand. Inventories are below intended levels. Firms will seek to increase inventory levels, prices will rise and output will increase. This would happen because competition among buyers will increase the price level; increased prices will encourage producers to increase their output and consumers will buy less. 480 Advanced Placement Economics Teacher Resource Manual © National Council on Economic Education, New York, N.Y. UNIT 3 Macroeconomics Answer Key LESSON 5 ■ ACTIVITY 25 Part B Changes in the Equilibrium Price Level and Output For each situation described below, illustrate the change on the AD and AS graph and describe the effect on the equilibrium price level and real GDP by circling the correct symbol: ↑ for increase, ↓ for decrease, or — for unchanged. Middle Class Tax Cut Increased Government Spending PRICE LEVEL 5. During a recession, the government increases spending on schools, highways and other public works. PRICE LEVEL 4. Congress passes a tax cut for the middle class, and the president signs it. SRAS AD1 SRAS AD1 AD AD Price level: — Real GDP: New Oil Discoveries Effects of an Increase in AD PRICE LEVEL SRAS SRAS1 AD1 AD Price level — Real GDP Advanced Placement Economics Teacher Resource Manual © National Council on Economic Education, New York, N.Y. ➞ ➞ — ➞ ➞ REAL GDP ➞ ➞ ➞ ➞ REAL GDP Real GDP — SRAS AD Price level — 7. Illustrate the effects of an increase in aggregate demand. PRICE LEVEL 6. New oil discoveries cause large decreases in energy prices. ➞ ➞ — ➞ ➞ Real GDP: REAL GDP ➞ ➞ Price level: ➞ ➞ REAL GDP — — 481 UNIT 3 Macroeconomics Answer Key LESSON 5 ■ ACTIVITY 25 8. Illustrate the effects of increases in production costs. 9. New technology and better education increase productivity. Effects of New Technology and Better Education Effects of Increases in Production Costs PRICE LEVEL SRAS1 PRICE LEVEL SRAS AD SRAS SRAS1 AD REAL GDP REAL GDP Price level — Real GDP 10. A new president makes consumers and businesses more confident about the future economy. Note: Show the change in AD only. — — 11. With the unemployment rate at five percent, the federal government reduces personal taxes and increases spending. Note: Show the change in AD only. Increased Confidence for Future Economy PRICE LEVEL ➞ ➞ ➞ ➞ — ➞ ➞ Real GDP ➞ ➞ Price level Reduced Taxes and Increased Government Spending LRAS PRICE LEVEL SRAS AD1 AD SRAS AD1 AD REAL GDP 482 Price level — Real GDP ➞ ➞ — ➞ ➞ Real GDP ➞ ➞ Price level ➞ ➞ REAL GDP — — Advanced Placement Economics Teacher Resource Manual © National Council on Economic Education, New York, N.Y. UNIT 3 Macroeconomics Answer Key LESSON 5 ■ ACTIVITY 25 Part C Summarizing Aggregate Demand and Aggregate Supply Shifts 1. Increase in labor productivity due to technological change 2. Increase in the price of inputs used by many firms 3. Boom in investment assuming some unemployed resources are available 4. A major reduction in investment spending PRICE LEVEL PRICE LEVEL PRICE LEVEL PRICE LEVEL For each of the events below, make additions to the graph to illustrate the change. Then indicate the response in terms of shifts in or movements along the aggregate demand or aggregate supply curve and the short-run effect on real GDP and the price level. Indicate shifts in the curve by S and movements along the curve by A. Indicate the changes in price level, unemployment and real GDP with an up arrow for an increase and a down arrow for a decrease. SRAS1 SRAS AD SRAS1 SRAS AD SRAS AD1 AD SRAS AD1 AD REAL GDP REAL GDP REAL GDP REAL GDP AD Curve A A S S AS Curve S S A A Real GDP Price Level Unemployment Advanced Placement Economics Teacher Resource Manual © National Council on Economic Education, New York, N.Y. 483 UNIT 3 Macroeconomics LESSON 5 ■ ACTIVITY 26 Answer Key Reconciling the Keynesian Aggregate Expenditure Model With the Aggregate Demand and Aggregate Supply Model Now it is time to reconcile the Keynesian aggregate expenditure model with the aggregate demand and supply model. We find both differences and similarities when comparing the two models: 484 ■ The Keynesian model is a fixed, or constant, price model while the AD and AS model is a variableprice model. The vertical axis of the Keynesian model is aggregate expenditure while the vertical axis of the AD and AS model is price level. ■ Aggregate expenditure (C + I + G + Net Exports) on the Keynesian model is aggregate demand on the AD and AS model. A shift upward in aggregate expenditure is the same as a shift outward in aggregate demand. A shift downward of aggregate expenditure is the same as a shift inward of aggregate demand. ■ The ADs and AS model can account for shifts in aggregate supply. The Keynesian model cannot do so. ■ In the Keynesian model, a shift in aggregate expenditures results in the full multiplier effect, and the multiplier can easily be calculated from the graphs. In the AD and AS model, the multiplier is not at full strength on the positively sloped and vertical AS curves. ■ In the AD and AS model, the increase in the price level diminishes the impact of the multiplier. Advanced Placement Economics Teacher Resource Manual © National Council on Economic Education, New York, N.Y. UNIT 3 Macroeconomics LESSON 5 ■ ACTIVITY 26 Answer Key For each of the following situations, illustrate the indicated change on both the AD and AS model and the Keynesian model. 1. The economy is at less than full employment. An increase in consumer confidence moves the economy to full employment. Figure 26.1 An Increase in Consumer Confidence Less Than Full Employment Using the AD and AS Model Less Than Full Employment Using the Keynesian Model AE1 PRICE LEVEL SRAS AD1 AD AGGREGATE EXPENDITURES LRAS AE 45˚ FE REAL GDP REAL GDP 2. The economy is at full employment but businesses begin to believe that a recession is ahead. Figure 26.2 Businesses Believe a Recession Is Coming Full Employment Using the AD and AS Model Full Employment Using the Keynesian Model PRICE LEVEL SRAS AD AD1 AGGREGATE EXPENDITURES LRAS AE AE1 45˚ REAL GDP FE REAL GDP Advanced Placement Economics Teacher Resource Manual © National Council on Economic Education, New York, N.Y. 485


