Guide to superimposition of profile radiographs by
advertisement
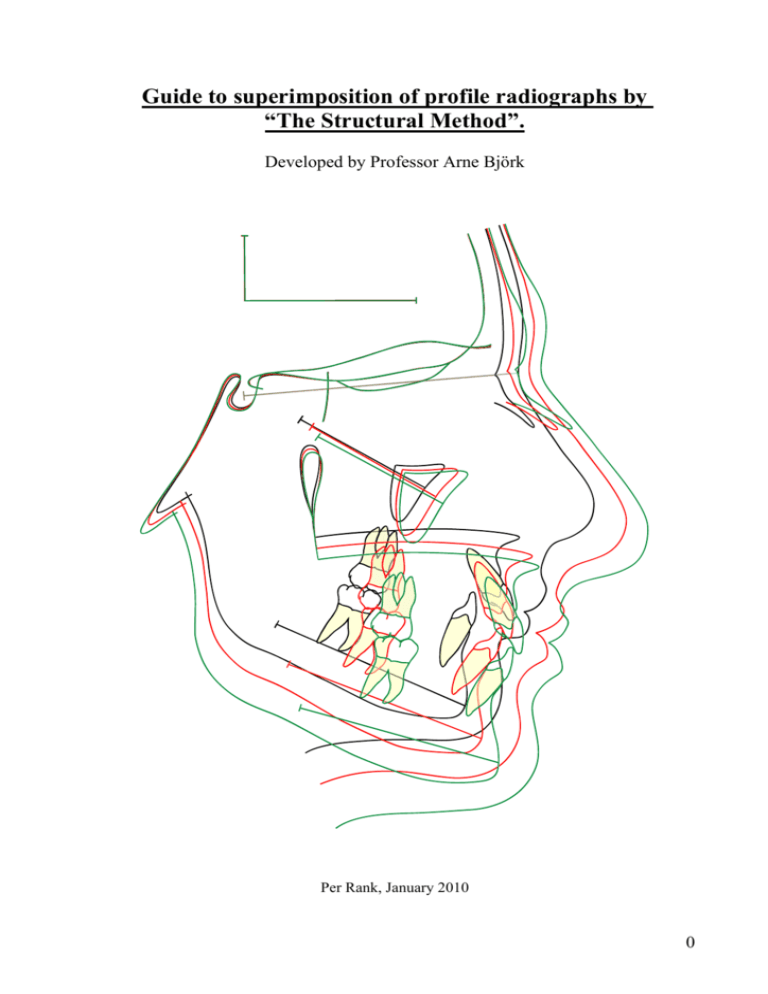
Guide to superimposition of profile radiographs by “The Structural Method”. Developed by Professor Arne Björk Per Rank, January 2010 0 Superimposition on the anterior cranial base: Figure 1. The nasion-sella line ( NSL ) has been used for many years as a reference line in longitudinal growth studies. But the nasion point (n) is not stable. Due to apposition in the glabella region, nasion moves forward in an upward or downward direction throughout the whole growth period. Point nasion can therefore not be used as a stable reference point in longitudinal growth studies. ( figure 1 ). Eccentric remodelling of the sella turcica during the whole growth period results in a displacement of point sella (s) often in a backward-downward direction. Point sella can therefore not be used as a stable reference point. Longitudinal growth studies by Björk using metallic bone markers in more than 200 children have shown that certain structures in the anterior cranial base are stable after a certain age. These observations have been verified histologically by Melsen ( 1974 ). Figure 2. . Figure 2. 1 The stable anatomical structures in the anterior cranial base are: Figure 3. 1) The inner contour of the anterior wall of sella turcica. ( stable after the age of 5-6 years ). 2) The mean intersection point of the lower contours of the anterior clinoid processes and the contour of the anterior wall of sella, Walkers´s point. ( stable after the age of 5-6 years). Figure 4. 3) The anterior contours of the middle cranial fossae. ( stable after the age of 12-14 years). 4) The contour of the cribriform plate ( stable after the age of 4 years ). 5) Details in the trabecular system in the anterior cranial base. ( stable after the age of 4 years ). 6) The contours of the bilateral fronto-ethmoidal crests. ( stable after the age of 4 years ). 7) The cerebral surfaces of the orbital roofs (stable after the age of 5-6 years of age ). Figure 4. These stable anatomical structures in the anterior cranial base are used as reference structures when radiographs from different age stages are superimposed. This is called “The structural Method”. 2 Figure 5. Figure 6. Figure 5 shows a profile radiograph of a skull with the contours of the middle cranial fossae and figure 6 shows the same skull with a lead foil marking the middle cranial fossae . Figure 7. Figure 8. Figure 7 shows the cribriform plate and crista galli from above and figure 8 shows sella turcica, planum sphenoidale, the cribriform plate ( arrow ) and crista galli seen in the mid- sagittal plane. Figure 9. Figure 10. Figure 9 and 10 show the fronto-ethmoidal crest. 3 Figure 11. Figure 12. Figure 11 and 12 show clivus and point basion, ba. Figure 13. Figure 14. Figure 13 shows the bisector between the double contour of the orbital roofs, and figure 14 shows the orbital roof on a skull. 4 By superimposition of profile radiographs from three or more stages of untreated individuals, a logical sequence of growth changes should be expected. The points, nasion (n). articulare (ar), ptherygomaxillare (pm), the anterior nasal spine (sp) and pogonion (pg) should follow a logical path during normal growth. Figure 15. In orthodontically or surgically treated cases these structures may change position in a different way. Figure 15. 5 Mandibular superimposition: Figure 16. The stable anatomical structures of the mandible are : 1) The anterior contour of the chin. 2) The inner cortical structure at the inferior border of the symphysis. 3) Trabecular structures in the symphsis. 4) Trabecular structures related to the mandibular canal. 5) The lower contour of a molar germ from the time mineralization of the crown is visible until the roots begin to form. To understand the background for this superimposition technique, you should read the study by Björk : 6 “Prediction of mandibular growth rotation”. Am. J. Orthod.1969; 55: 585-599 . I will quote a few paragraphs, from this article: “ Mandibular growth pattern. It has been confirmed by the implant technique that growth in length of the mandible in man occurs essentially at the condyles. The anterior aspect of the chin is extremely stable, no growth having been found here except in a few cases of pathologic development. The thickening of the symfysis, therefore, normally takes place by apposition on its posterior surface. On its lower border there is likewise apposition, which contributes to the increase in height of the symfysis. As the endosteal resorption in this area does not occur at the same rate as the apposition on the outer surface, a pronounced apposition will be reflected in an increase in the thickness of the cortical substance. The periosteal apposition below the symfysis is extended posteriorly to the anterior part of the lower border of the mandible, and when it is marked this area is characteristically rounded. Below the angle of the mandible there is normally resorption, which may be very pronounced. In some cases there is, instead, apposition on the lower border at the angle of the jaw. These appositional and resorptive processes result in an individual shaping of the lower border of the mandible, which characterizes the type of growth. The growth of the condyles usually does not occur in the direction of the ramus, as is commonly imagined, but slightly forward. Individual variations in the direction of growth at the condyles are large and, in the adolescent period, have been found to vary almost 45 degrees. Growth is not always linear in direction but usually curves slightly forward or occasionally even backward. The pattern of mandibular growth is thus generally characterized by an upward- and forward-curving growth at the condyles, while at the same time there is resorption on the lower aspect of the gonial angle and some apposition below the symfysis. The mandibular canal is not remodelled to the same extent as the outer surface of the jaw, and the trabeculae related to the canal are therefore relatively stationary. The curvature of the mandibular canal, therefore reflects the earlier shape of the mandible. The lower border of a developing molar germ in the mandible appears to be fairly stationary until the roots begin to form. This means that, for a period, the tooth germ may serve as a natural reference structure in the growth analyses of the mandible”. 7 Maxillary superimposition : Figure 17. The only stable structure in the maxilla is the anterior contour of the zygomatic process. Normally there is more apposition on the orbital floor than resorption on the nasal floor ( orbital floor 3 up and nasal floor 2 down ). Figure 18. Figure 18 shows the zygomatic processes and nasal floor in a frontal view. Do note that the nasal floor is a double structure on both sides of the nasal septum. 8 Figure 20. Figure 21. The outline of the nasal floor is often a more or less straight line, figure 20. The contour of the nasal septum should not be traced, figure 21. Figure 22. Figure 23. Figure 22 shows the anterior contour of the zygomatic process and figure 23 shows the double contour of the two zygomatic processes. Figure 24. Figure 24 shows the anatomy of the zygomatic process and the orbital floor. 9 To understand the background for this complicated superimpositioning technique, you should read the study by Björk and Skieller: “ Growth of the maxilla in three dimensions as revealed radiographically by the implant method ”. Br. J. Orthod 1977 ; 4: 53-64. I will quote a few paragraphs from this article: “ Previous implant studies ( Björk, 1955, 1966 ) have confirmed that the increase in the maxillary height takes place by growth at its processes; suturally toward the frontal and zygomatic bones and appositionally on the lower aspects of the alveolar process in association with eruption of the teeth. Apposition also occurs at the floor of the orbits with resorptive remodelling of the lower surface. Simultaneously, the nasal floor is lowered by resorption and an apposition takes place at the hard palate. The mean growth changes from the age of 4 years until adult age in nine cases are given in figure 25 and 26. The sutural lowering of the maxilla (s), was on average 11,2 mm. The orbits do not increase in height from childhood through adolescence to the same degree as the nasal cavity. The sutural lowering of the maxillary corpus was, therefore to some extent compensated for by apposition at the floor of the orbits ( a), on an average of 6,4 mm. The lowering of the floor of the orbits from the age of 4 was thus somewhat less than half the sutural lowering of the maxillary corpus. The height of the nasal cavity up through puberty also increased as a result of the resorptive lowering of its floor ( r). This lowering was on an average 4,6 mm, i.e. about one-third of the increase in sutural height of the nasal cavity. The mean appositional growth in height of the alveolar process ( e), amounted to 14,6 mm. The appositional growth in height of the alveolar process was thus on an average about one-third greater than the increase in height of the alveolar process as seen in relation to the nasal floor which was lowered 4,6 mm by resorption. In other words if you measure the alveolar growth to the palatal plane, you loose one third of the actual growth ( Rank ). “Superimposition of longitudinal profile radiographs on the anterior cranial base shows generally an almost parallel lowering of the nasal floor, as described by Brodie in 1941. This observation led to the view that during growth the maxilla is lowered without rotation in the vertical plane. However, implant studies ( Björk and Skieller, 1972 ) have shown that the downward and forward displacement of the maxilla during growth is associated with a varying degree of vertical rotation, as a rule directed forward. Despite the maxillary rotation in the vertical plane, the inclination of the nasal floor to the anterior cranial base is maintained as a result of a compensatory differentiated resorption . In cases of a forward rotation of the maxilla, the resorption at the nasal floor is greater anteriorly than posteriorly, whereas cases of backward rotation are associated with a more pronounced resorption posteriorly. As a consequence of this differentiated remodelling, the contour of the nasal floor cannot be used as a reference 10 structure in the radio-graphic cephalometric analysis of the growth of the maxilla. ( figure 25 ). Likewise the floor of the orbit maintains its inclination in relation to the anterior cranial base irrespective of the rotation of the maxilla due to remodelling. The conclusion of the above analysis is that the anterior contour of the zygomatic process was found to be strikingly stable on the profile radiographs in the sagittal direction. This was characteristic for all nine cases. It should therefore be possible to regard the anterior contour of the zygomatic process as a natural reference structure in the growth analysis of the maxilla, where this contour can be identified from film to film “. Figure 25. Figure 26. Figure 25 shows the superimposition on the stable structure in the maxilla. “The transfer guide” in the anterior cranial base shows the amount of rotation of the maxilla and the amount of sutural lowering of the maxilla in the face (s 11,2 mm) . The amount of apposition on the orbital floor ( a 6,4 mm ) resorption at the nasal floor ( r 4,6 mm ) and amount of eruption of the teeth ( e 14,6 mm ) can be measured on the tracing. Figure 26 shows the superimposition on the stable structures in the anterior cranial base. The sutural lowering and rotation of the maxilla can be measured between the implant lines in the maxilla. The orbital floors are lowered with the amount of sutural growth minus the amount of apposition. The lowering of the nasal floor is the amount of sutural 11 growth plus the amount of resorption on the nasal floor. The upper occlusal plane is lowered with the amount of sutural growth plus the amount of eruption of the teeth. Enlargement of profile radiographs: Before starting tracing the radiographs, be sure they have the same enlargement. You can calculate the enlargement of your radiographs by dividing the distance from the xray anode to the film by the distance from the x-ray anode to the mid-sagittal plane of the head. Figure 27. If the distance from the x-ray anode to film plane is 150 cm and the distance from the mid-sagittal plane is 10 cm, the enlargement is 150 divided by 140 multiplied by 100% giving 107% , then you have an enlargement factor of 7%. Be sure that the distances from the x-ray anode to the mid-sagittal plane and to the film plan are fixed. 12 Tracing and superimposition of two profile radiographs on the computer : Use digital radiographs or scan the profile radiographs into your computer and import them into your tracing program. If you have different enlargement on your radiographs, you can correct it here. In the following I will show, how I am tracing two profile radiographs and superimpose them in the program “Adobe Illustrator”. There are a number of other tracing programs, where you ca do exactly the same. Open Adobe Illustrator and click on File in the Menu bar, and click on Open. Now go to your files and select your first profile radiograph. If you have to correct the enlargement, choose Object in the Menu bar and click on Transform and further Scale and correct the enlargement. This first document is called document A. If your radiograph is not taken in “The Natural Head Position”, rotate the radiograph until “The Frankfurt Horizontal” is parallel to the bottom of the page, Go to Layers in the Floating palettes. Open four extra layers and lock the first layer with the radiograph. Select the second layer and start tracing the radiograph. Start tracing the anterior contour of the frontal bone down to point nasion ( n), trace the outer and inner contour of the nasal bone. Trace the inner contour of the frontal bone and continue to the fronto-ethmoidal crests , (6) in figure 3, a double contour is often seen because it represents the median corners of the orbital roofs. When there is a double contour trace the bisector. Continue the line to planum sphenoidale and trace the inner contour of sella turcica , very accurately (1) in figure 3. Continue the line to the posterior clinoid processes, the dorsum sellae and the clivus all the way down to foramen magnum and trace the outer surface of the cranial base. Make it an unbroken line from the inner contour of frontal bone. Trace the cribriform plate beneath the frontoethmoidal crests (4) in figure 3, and trace the upper surfaces of the orbital roofs (7) in figure 3 and continue the line to the anterior clinoid processes. Trace the mean intersection of the lower contours of the anterior clinoid processes very accurately, ( Walker`s point , figure 4 ) this is one of the most important points in superimposition on the anterior cranial base . Trace the anterior wall of the middle cranial fossae (3) in figure 3 and the small details of the trabecular system in the ethmoidal bone (5) figure 3. Trace the zygomatic processes with the floors of the orbits as an unbroken line. Trace the pterygoid fossae. Al these structures often have double contours, choose the mean bisector. When you trace the nasal floor, start at the upper surface of the soft palate and continue forward to the nasal spine and down to the anterior part of the maxilla and down to the upper incisors. Trace the outer contour of the mandible from the articular point, ar, all the way downward and forward to the mental point. Trace the contour of the chin very accurately. Trace the inner contour and the small details of the trabecular system in the symfysis ( 2 and 3) in figure 16. Trace the mandibular canal and a tooth germ of a molar. Trace the soft tissue profile. 13 Lock the second layer and go to the third layer. Select the Pen tool and trace “The Transfer guide” or “The implant line in the anterior cranial base” ( Pierre Planche ) , a vertical line 3 cm high and a horizontal line 6 cm long in the anterior cranial base ( 1 ) in figure 28 . Trace “The implant line in the maxilla”, any line from the anterior contour of the zygomatic process, 4 cm long ( 2) in figure 28. Trace “The implant line in the mandible”, any line from point pogonion backwards 6 cm long. Trace the nasion-sella line. Lock this layer and go to the fourth layer. Open a new document with the tooth templates. Select the incisors and molars and import them into the fourth layer. Select the upper incisor template and adjust it in size and shape to the actual upper incisor. Do the same for the lower incisor and the upper and lower molars. 1 2 3 Figure 28. Now open a new document B with the second profile radiograph, and open two extra layers. Lock the layer with the radiograph, and go to the second layer. Now go back to document A with the first radiograph and open the second layer (the tracing without the implant lines ). Select the whole tracing and export it to the second layer of document B with the second radiograph and make it red. It is much easier to use the old tracing and 14 just drag and adjust the lines to the new radiograph. When the second radiograph has been “traced”,go back to document A and open layer number three. Select the teeth and export them to the third layer in document B. Now place the teeth correctly over the radiograph. Figure 29. Superimposition on the anterior cranial base : Now we have the tracing of the first radiograph with the implant lines in the cranial base and in the maxilla and the mandible ( document A, figure 28). We also have the tracing of the second radiograph without any lines ( document B, figure 29 ). We now have to superimpose the second radiograph on the first radiograph on the stable anatomical structures in the anterior cranial base. Open and select layer two and three in document B ( figure 29 ) and export it to layer five in document A ( figure 28 ). Now move and rotate the tracing of the second radiograph over the tracing of the first radiograph until the stable structures of the anterior cranial base fit, figure 30 and 31. Open layer three in document A and select and export “The Transfer Guide” to layer five, make it red and superimpose it on top of the first transfer guide and, figure 32. 15 Choose the pen tool and trace the nasion-sella line, so it fits over the nasion-sella line on the first radiograph. Figure 32. Figure 30. Figure 31. Figure 32. Now the two radiographs have been superimposed on the anterior cranial base. This is called the general superimposition. 16 Superimposition of the maxilla: Open a new document C. Go to document A with the first radiograph. Open the second, third and fourth layer and export the tracing of the first radiograph to document C. Erase everything but the maxilla, the teeth and the implant line and the transfer guide. Lock the first layer and open a second layer. Go back to document A and open layer 5 with the tracing of the second radiograph and export the tracing to the second layer in document C. Erase everything but the maxilla with the teeth and the transfer guide. Superimpose the second tracing of the maxilla on the stable anterior contour of the zygomatic process until the apposition on the orbital floor is slightly more than the resorption on the nasal floor ( 3 to 2 ), figure 34. Now transfer the implant line in the maxilla from the first stage to the second stage, make it red and superimpose it over the first implant line, figure 35. Figure 33. Figure 34. Figure 35. You can transfer the implant line in the maxilla of the second stage by exporting the superimposed tracing to the general superimposition. 17 Superimposition of the mandible: Open a new document D. Go back to document A with the first radiograph. Open the second, third and fourth layer and export the tracing of the first radiograph to document D. Erase everything but the mandible, the implant-line in the mandible, the transfer guide and a small piece of line, marking the articulare point, figure 36. Lock the layer and open a second layer. Go back to document A and open the fifth layer with the tracing of the second radiograph and export the tracing to the second layer in document D. Erase everything but the mandible, the transfer guide and a small piece of line marking the articulare point. Superimpose the second tracing on the stable structures in the mandible of the first stage, figure 37. When you have found the best fit, transfer the implant line from the first stage to the second layer, make it red and superimpose it on the implant line of the first stage, figure 38. Figure 36. Figure 37. Figure 38. 18 Outline of documents and layers: Document A First layer : First radiograph Second layer : Tracing of first radiograph, black Third layer : Implant lines Fourth layer : Tooth templates Fifth layer : Tracing of second radiograph with teeth, red, import document B, second and third layer Document B First layer : Second radiograph Second layer : Tracing of first radiograph, red, import document A, second layer Third layer : Teeth, red , import document A, fourth layer Document C First layer : Import document A, second, third and fourth layer, black Second layer : Import document A, fifth layer, red Document D First layer : Import document A, second, third and fourth layer, black Second layer : Import document A, fifth layer, red 19 Interpretation of jaw rotation: - 13o -5o -13o Figure 39. Figure 40. If the growth of the mandible is in a downward-forward direction, the rotation of the mandible is called forward. Sometimes this rotation is called anti-clockwise, but this can be misunderstood, if the face is turned to the left, which is common in Denmark and Switzerland. The amount of rotation of the mandible can be measured as the angle between the implant lines of the first and the second stage. In the example in figure 39, the amount of anterior rotation is -13o, minus if the rotation is forward, plus if the rotation is in a posterior direction ( sometimes called clockwise ). In the superimposition of the mandible the amount of rotation can also be measured as the angle between the transfer guide of the first and second stage, figure 40. In a untreated individual with normal growth, one degree of anterior rotation of the mandible ( - 1o ) per year should be expected. The rotation of the maxilla is often in the same direction as the mandible but the amount of rotation is often only one third of the rotation of the mandible. 20 5o 5o Figure 41. Figure 41 shows an untreated girl with posterior rotation of both the maxilla and the mandible. The amount of rotation of the mandible is 5o, ( plus for posterior rotation ). Posterior growth rotation of the jaws is rare in untreated individuals. In longitudinal growth studies in the literature the range of posterior rotation is from 0 to 7 %. However posterior rotation of the jaws is often seen in orthodontically treated patients. 21 22 23 24
