Graphical Analysis of Motion I
advertisement

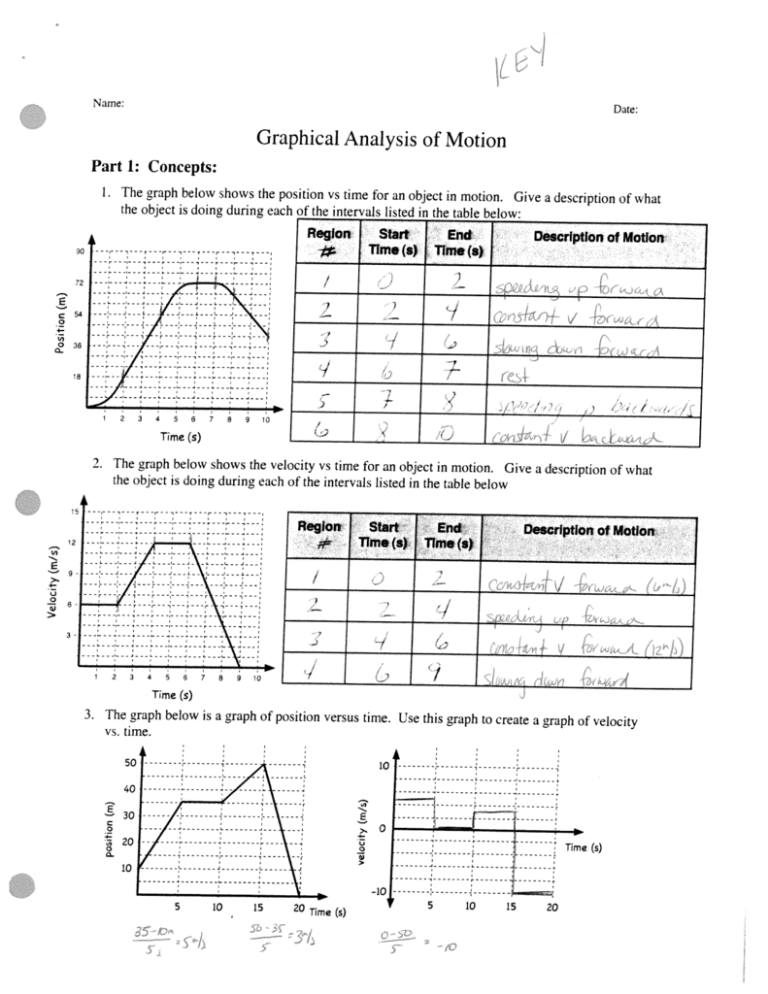
___________ ___________ ___________ ___________ __ Name: Date: Graphical Analysis of Motion Part 1: Concepts: 1. The graph below shows the position vs time for an object in motion. Give a description of what the object is doing during each of the intervals listed in the table below Region go 72 Start Time(s) End Time(s) Description of Motion I -— E 54 — ‘1 0 1 0 36 / -, I 18 ; 2 4 3 6 5 Time 7 8 9 / ) 10 (s) 2. The graph below shows the velocity vs time for an object in motion. Give a description of what the object is doing during each of the intervals listed in the table below 15 Region 12 ‘I, E U 0 5) Start lime(s) End Time(s) Description ot Motion 9- V > 3 I, 1 2 3 4 5 6 Time 7 8 9 10 J (s) 3. The graph below is a graph of position versus time. Use this graph to create a graph of velocit y vs. time. - E C 0 Time (s) 0 ‘3- 5 10 15 20 Time (s) 5 10 1520 1: Motion Name__________________________ Worksheet B: Interpreting Motion Graphs ANSW QUCSTIONS AND AP/Inquiry Physics 2 iN COMPLETE SENTENCES What does the slope ofa distance vs. time graph indicate about an object’s motion? I. 2. What does the slope of a speed vs. time graph indicate about an object’s motion? Questions 3 -8 refer to the following generic graph shapes. Write the letter corresponding to the appropriate graph in the blank at the left of each question. BCDE / - 3. Which shape fits a distance vs. time graph of an object moving at constant (non-zero) speed? 4. Which shape fits a speed vs. time graph of an object moving at constant (non-zero) speed? 5. Which two shapes fit a distance vs. time graph of a motionless object? 6. Which shape fits a speed vs. time graph of a motionless object? 7. Which shape fits a distance vs. time graph ofan object that is speeding up at a steady rate? 8. Which shape fits a speed vs. time graph of an object that is speeding up at a steady rate? 9. Which of the following units is equivalent to (meters,per second) per second? a) rn b) rn/s c) rn/s 2 10. 11. d) 3 m/s Which of the following units correspond to the slope ofa distance vs. time graph? a) rn b) s c) rn/s d) 2 m/s Which of the following units correspond to the slope of a speed vs. time graph? a) mis b) rns c) rn/s 2 d) s 2 m CONT NUED... Unit 1: Moton, WorksheetS: nterprekng Moton Graphs Page 1 of 2 2008 by G. Meador — w inguiryphysi org _ ________ _____ ________ ________ ls are changing as the for a moving object. Pay attention to how the rime interva The table below gives distance and time data distance rises in 20 rn increments. Time (a) Distance (m) 0 0 4.5 20 6.3 40 7,7 60 8.9 80 10 100 12. onds to the table data? Which of the following distance vs. time graphs corresp d d’ a) 13. 14. Z b) c) J d) selected in question 12? Which of the following descriptions matches the graph you a) A motionless object. b) An object moving at a constant speed. c) An object undergoing constant, positive acceleration. ation. d) An object undergoing constant, negative acceler to the table data? Which of the following speed vs. time graphs corresponds C)] b) d) - IS. BEWARE: 16. selected in question 14? Which of the following descriptions matches the graph you object. a) A motionless b) An object moving at a constant speed. ation. c) An object undergoing constant, positive acceler ation. acceler e nt, negativ d) An object undergoing consta each other, you are claiming that the same object can lfyour answers to questions 13 and 15 are different from that reasonable?” Is lf, have two distinct motions simultaneously. Ask yourse t line. A woman walks away from a starting point in a straigh right. at shown is motion her for graph A distance vs. time s. a. Describe the woman’s motion between 0 and 2 second 0 a, C) Cu 0 b. Fill out the table below. You do not have to show your work. Woman’s Speed (mis) Time Interval Time (s) 2 to 4 seconds 4 to 6 seconds 6 to 8 seconds Unit 1: Motion, Worksheet B: lriterpretin9 Motion Graphs Page 2 of 2 2008 by G. Meador — .ww inguiryphysics org ___________ ___________ ___________ ___________ _ _____. ___________ ___________ ___________ Motion in One Dimension ______ Name: Describing Motion Graphically Study Lessons 3 and 4 of the 1-D Kinematics chapter at The Physics Classroom: http://www.physicsclassroom.com/Class/lDKinilDKinTOC.html MOP Connection: Kinematic Graphing: sublevels 1-11 (emphasis on sublevels 9-Il) The slope of the line on a position vs. time graph reveals information about an objects velocity. The magnitude (numerical value) of the slope is equal to the objects speed and the direction of the slope (upward/-- or downward!-) is the same as the direction of the velocity vector. Apply this understanding to answer the following questions. a Ahorizontalline means —‘B E b. A straight diagonal line means A — c. Acurvedlinemeans d A gradually sloped line means e. Asteeply sloped line means : - // Te f The motion of several objects is depicted on the position vs. time graph. Answer the following questions. Each question may have less than one, one, or more than one answer. Ti, Ti a. Which object(s) is(are) at rest? A b. Which object(s) is(are) accelerating? c. Which object(s) is(are) not moving? Which object(s) change(s) its direction? & e. Which object is traveling fastest? f. Which moving object is traveling slowest? 3. The slope of the line on a velocity vs. time graph reveals information about an object’s acceleration. Furthermore, the area under the line is equal to the objects displacement. Apply this understanding to answer the following questions. a. Ahorizontalline means &° b A straight diagonal line means c A gradually sloped line means d. A steeply sloped line means , 4. The motion of several objects is depicted by a velocity vs. time graph. Answer the following questions. Each question may have less than one, one, or more than one answer. a. Which object(s) is(are) at rest? b. Which object(s) is(are) accelerating? Which object(s) is(are) not moving? d. Which object(s) change(s) its direction? Which accelerating object has the smallest acceleration? 1. Which object has the greatest acceleration? e iT The Physics Classroom, 2009 Page 1 5. The graphs below depict the motion of several different objects. Note that the graphs include both position vs. time and velocity vs. time graphs. j[ / I Graph C Graph B Graph A Graph D Graph E The motion of these objects could also be described using words. Analyze the graphs and match them with the verbal descriptions given below by filling in the blanks. Graph Verbal Description a with slow moves then and velocity constant a with fast moving is object The a. constant velocity. h. The object is moving in one direction with a constant rate of acceleration (slowing down), changes directions, and continues in the opposite direction with a constant rate of acceleration (speeding up). c. The object moves with a constant velocity and then slows down. d. The object moves with a constant velocity and then speeds up. e. The object maintains a rest position for several seconds and then accelerates. Consider the position-time graphs for objects A, B, C and D. On the ticker tapes to the right of the graphs, construct a dot diagram for each object. Since the objects could be moving right or left, put an arrow on each ticker tape to indicate the direction of motion. A A L K + ‘3 0 .‘-- C, c ,. D Consider the velocity-time graphs for objects A, B, C and D. On the ticker tapes to the right of the graphs, construct a dot diagram for each object. Since the objects could be moving right or left, put an arrow on each ticker tape to indicate the direction of motion. vel A A ( K + 11 Ct I_+ D D The Physics Classroom, 2009 Page 2


