BCS10_C01_F
3/11/08
12:44 PM
Page 16
Climatographs
Conduct an Investigation 1-1C
on page 30
Month
Average
Precipitation
(mm)
Average
Temperature
(°C)
J
F
M
A
M
J
J
A
S
O
N
D
436
382
355
249
165
138
77
94
134
340
475
462
4
5
6
8
10
12
14
15
13
10
7
5
Climatograph
Tofino, British Columbia, 49ºN
Average Precipitation (mm)
Suggested Activity
600
25
500
15
400
5
300
–5
200
–15
100
–25
0
J F M A M J J
A S O N D
–35
Month
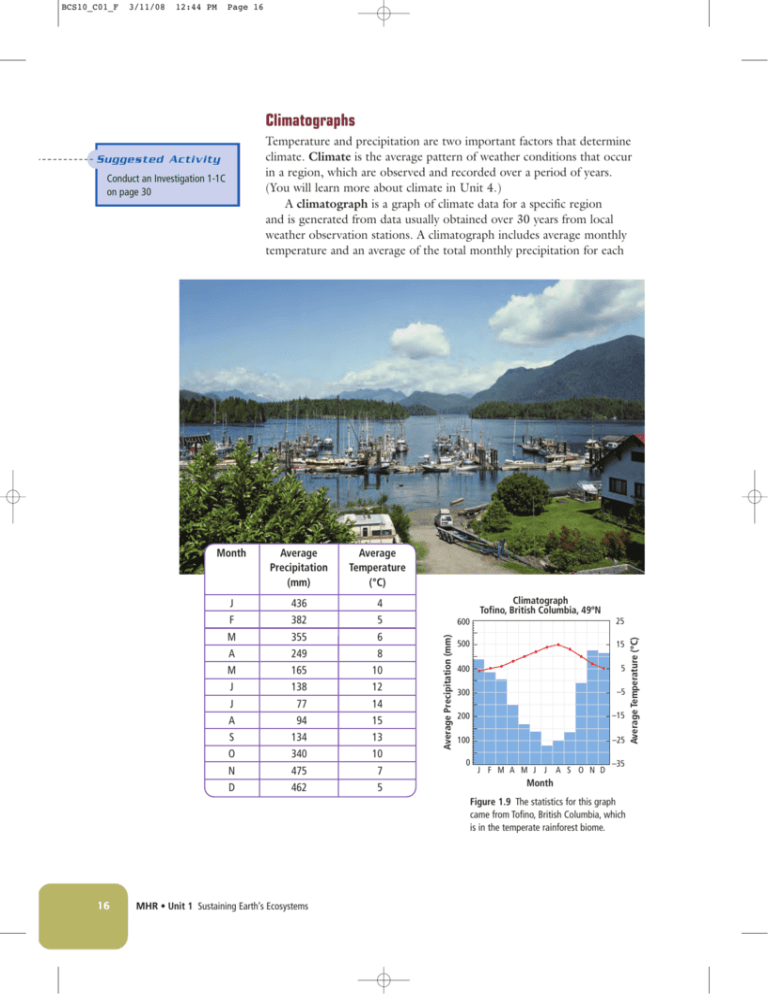
Figure 1.9 The statistics for this graph
came from Tofino, British Columbia, which
is in the temperate rainforest biome.
16
MHR • Unit 1 Sustaining Earth’s Ecosystems
Average Temperature (ºC)
Temperature and precipitation are two important factors that determine
climate. Climate is the average pattern of weather conditions that occur
in a region, which are observed and recorded over a period of years.
(You will learn more about climate in Unit 4.)
A climatograph is a graph of climate data for a specific region
and is generated from data usually obtained over 30 years from local
weather observation stations. A climatograph includes average monthly
temperature and an average of the total monthly precipitation for each
12:44 PM
Page 17
month. Comparing climatographs can give you a greater understanding
of the temperature and precipitation patterns in regions within a
biome. You can also use climatographs to compare temperature and
precipitation patterns in regions that are in different biomes, as shown
in Figure 1.9 on the previous page and Figure 1.10 below. On a
climatograph, the month of the year is shown on the horizontal axis.
Average temperature is shown on the right vertical axis, and average
precipitation is shown on the left vertical axis.
Month
Average
Precipitation
(mm)
Average
Temperature
(°C)
J
F
M
A
M
J
J
A
S
O
N
D
12
18
20
23
37
36
24
21
16
17
26
17
!2
1
6
11
15
19
22
21
16
10
4
!1
Did You Know?
Osoyoos is home to Canada’s only
desert. It is the uppermost part of
the Great Basin Desert and is
called the Pocket Desert.
Climatograph
Osoyoos, British Columbia, 49ºN
600
25
500
15
400
5
300
–5
200
–15
100
–25
0
J F M A M J
J
A S O N D
Average Temperature (ºC)
3/11/08
Average Precipitation (mm)
BCS10_C01_F
–35
Month
Figure 1.10 The statistics for this
graph came from Osoyoos, British
Columbia, which is in the desert biome.
Chapter 1 Biomes and ecosystems are divisions of the biosphere. • MHR
17
DATE:
NAME:
CHAPTER 1
Practise Reading Climatographs
CLASS:
BLM 1-8
Goal • Compare climatographs from three locations that are typical of different biomes.
Question
What inferences can you make by comparing the climatographs from three locations?
What to Do
The following climatographs give temperature and precipitation data for three typical locations
within three biomes. Use the data from the climatographs to complete the table below. You will
have to estimate values.
Copyright © 2008, McGraw-Hill Ryerson Limited, a subsidiary of the McGraw-Hill Companies. All rights reserved.
This page may be reproduced for classroom use by the purchaser of this book without the written permission of the publisher.
DATE:
NAME:
CLASS:
BLM 1-8
continued
Biome
1
2
3
Warmest average monthly
temperature (°C)
Month with warmest average
temperature
Coldest average monthly
temperature (°C)
Month with coldest average
temperature
Driest month and total
amount of precipitation for
this month (mm)
J:
M:
A:
O:
Month:
Total
precipitation:
J:
M:
A:
O:
Month:
Total
precipitation:
J:
M:
A:
O:
Month:
Total
precipitation:
Wettest month and total
amount of precipitation for
this month (mm)
Month:
Total
precipitation:
Month:
Total
precipitation:
Month:
Total
precipitation:
Start and end of growing
season (months where
temperatures first rise above
or fall below 5°C)
Start:
End:
Start:
End:
Start:
End:
Total precipitation (mm) in
January, March, August, and
October
Analyze
1. Which biome is the closest to the equator? Assume that there are no great differences in
altitude among the three locations. Explain your answer.
_______________________________________________________________________________
_______________________________________________________________________________
2. Which biome has the most northerly latitude? Explain your answer.
_______________________________________________________________________________
_______________________________________________________________________________
3. Which biome receives the most annual precipitation? Explain your answer.
_______________________________________________________________________________
_______________________________________________________________________________
Copyright © 2008, McGraw-Hill Ryerson Limited, a subsidiary of the McGraw-Hill Companies. All rights reserved.
This page may be reproduced for classroom use by the purchaser of this book without the written permission of the publisher.
DATE:
NAME:
CLASS:
BLM 1-8
continued
4. Which biome receives the least annual precipitation? Explain your answer.
_______________________________________________________________________________
_______________________________________________________________________________
5. Which biome has the longest growing season? Explain your answer.
_______________________________________________________________________________
_______________________________________________________________________________
6. Which biome has the shortest growing season? Explain your answer.
_______________________________________________________________________________
_______________________________________________________________________________
7. In which biome would animals need to have structural and behavioural adaptations to survive
long, cold winters? Explain your answer.
_______________________________________________________________________________
_______________________________________________________________________________
Conclude
8. Infer the biome that is represented by each climatograph. Provide two reasons why you made
each inference.
(a) Biome 1
____________________________________________________________________________
____________________________________________________________________________
____________________________________________________________________________
(b) Biome 2
____________________________________________________________________________
____________________________________________________________________________
____________________________________________________________________________
(c) Biome 3
____________________________________________________________________________
____________________________________________________________________________
____________________________________________________________________________
Copyright © 2008, McGraw-Hill Ryerson Limited, a subsidiary of the McGraw-Hill Companies. All rights reserved.
This page may be reproduced for classroom use by the purchaser of this book without the written permission of the publisher.

