Category Two: Accomplishing Other Distinctive Objectives
advertisement
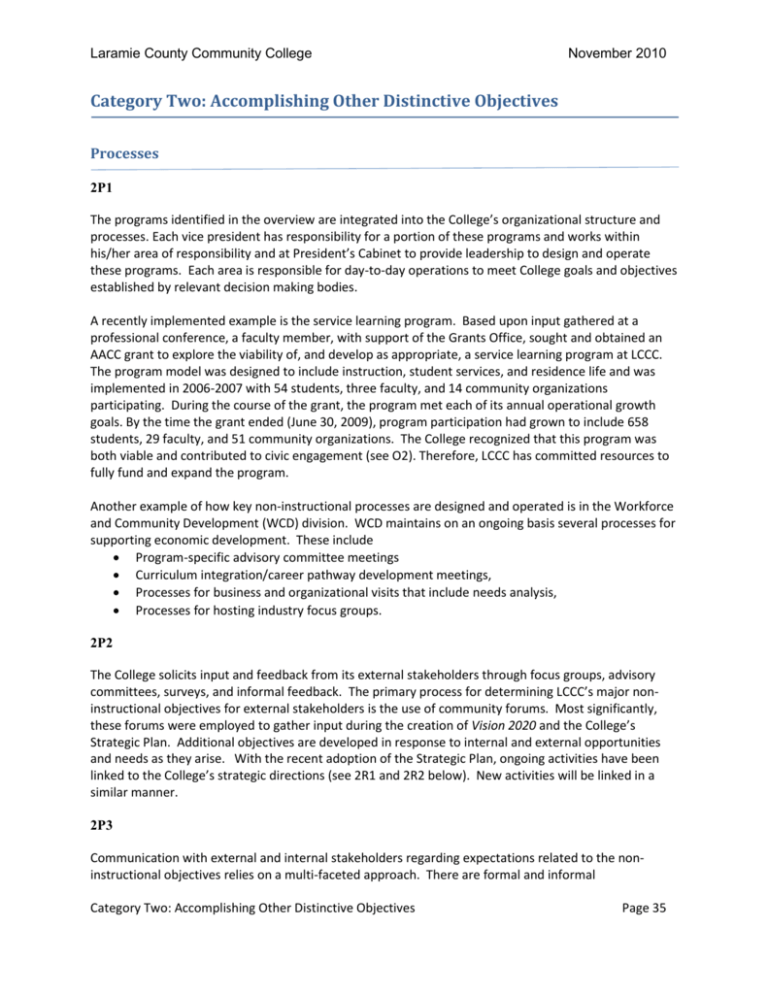
Laramie County Community College November 2010 Category Two: Accomplishing Other Distinctive Objectives Processes 2P1 The programs identified in the overview are integrated into the College’s organizational structure and processes. Each vice president has responsibility for a portion of these programs and works within his/her area of responsibility and at President’s Cabinet to provide leadership to design and operate these programs. Each area is responsible for day-to-day operations to meet College goals and objectives established by relevant decision making bodies. A recently implemented example is the service learning program. Based upon input gathered at a professional conference, a faculty member, with support of the Grants Office, sought and obtained an AACC grant to explore the viability of, and develop as appropriate, a service learning program at LCCC. The program model was designed to include instruction, student services, and residence life and was implemented in 2006-2007 with 54 students, three faculty, and 14 community organizations participating. During the course of the grant, the program met each of its annual operational growth goals. By the time the grant ended (June 30, 2009), program participation had grown to include 658 students, 29 faculty, and 51 community organizations. The College recognized that this program was both viable and contributed to civic engagement (see O2). Therefore, LCCC has committed resources to fully fund and expand the program. Another example of how key non-instructional processes are designed and operated is in the Workforce and Community Development (WCD) division. WCD maintains on an ongoing basis several processes for supporting economic development. These include Program-specific advisory committee meetings Curriculum integration/career pathway development meetings, Processes for business and organizational visits that include needs analysis, Processes for hosting industry focus groups. 2P2 The College solicits input and feedback from its external stakeholders through focus groups, advisory committees, surveys, and informal feedback. The primary process for determining LCCC’s major noninstructional objectives for external stakeholders is the use of community forums. Most significantly, these forums were employed to gather input during the creation of Vision 2020 and the College’s Strategic Plan. Additional objectives are developed in response to internal and external opportunities and needs as they arise. With the recent adoption of the Strategic Plan, ongoing activities have been linked to the College’s strategic directions (see 2R1 and 2R2 below). New activities will be linked in a similar manner. 2P3 Communication with external and internal stakeholders regarding expectations related to the noninstructional objectives relies on a multi-faceted approach. There are formal and informal Category Two: Accomplishing Other Distinctive Objectives Page 35 Laramie County Community College November 2010 communication mechanisms in place for each of the following groups: the Board of Trustees, the Foundation, the Wyoming Community College Commission, state and local government agencies, advisory committees, the general public, athletic collegiate bodies (external governing bodies with standards) as well as the campus community. Examples of formal mechanisms include regularly scheduled meetings, monitoring reports, the Strategic Plan, direct mailings, public relations, advertising, cultivating relationships and partnerships, and face-to-face, Board of Trustee and advisory committee expectation handbooks, and other publications. 2P4 While the College currently does not have a specific college-wide process in place to assess effectiveness or appropriateness of its distinctive non-instructional objectives, this will be addressed through implementation of the Strategic Plan. However, most of the identified areas require evaluations for each of their activities. These evaluations, along with informal feedback determine the effectiveness of the activities, events and programs. Individual areas have developed their own benchmarks and evaluate according to their outcomes. Adjustments are made as needed. 2P5 Faculty and staff needs are identified when the objectives are developed and again each year through the internal budgeting process. Requests to fill vacancies, new positions, and reassignments originate with each division or department. These needs are determined by the department or divisional goals and objectives which, in turn, are based on the College’s Strategic Plan (currently Vision 2020, with a new plan under development). These requests are forwarded to the appropriate vice president, who prioritizes them and brings them to the President’s Cabinet. At President’s Cabinet, the requests from all the vice presidents are prioritized according to funding, institutional resources, and overall needs of the college. 2P6 Divisions and departments gather information and set goals and priorities to support instruction based on input from advisory boards, accreditation bodies, student evaluations, faculty and staff. Performance evaluations also incorporate employee goals and contribute information. These sources of information are then incorporated into the college’s budgeting process for funding equipment and staffing needs. More informal processes are used for other types of objectives. Feedback from external stakeholders is also a driving force in readjusting objectives and processes. However, in regards to the development of its new Strategic Plan, which includes identification of other distinctive objectives, the college has actively solicited input from employees. Results 2R1, 2R2 The major non-instructional objectives are described in the introduction (question O2). The newly adopted Strategic Plan 2010-2015 incorporates these objectives and has established a system for regularly monitoring progress reports. Tables 2R1-2R2.1 – 2R1-2R2.3 show the Strategic Plan reference, measures, and results for each Objective. Category Two: Accomplishing Other Distinctive Objectives Page 36 Laramie County Community College Area November 2010 Table 2R1-2R2.1: Objective 1 – Cultural Programs and Community Development Strategic Plan 2R2: Performance Goal Number 2R1: Measures Results Cultural Development 2.5 Number of Events and Attendance State Workforce Development Activities Report Year-Ends Report Number of offerings Class evaluations Economic and Workforce Development 2.1 Conference Services 2.3 Career Center 2.7 Number of students using Kuder career assessment and exploration services Number and type of Career Center student contacts Student employment (applications and hires) Number of attendees and employers in career fairs Number of Groups Number of Activities Number of Participants Space utilization See Table 2R2a. See Table 2R2b for WFD Activities trends Approximately 20 new classes or workshops are offered each year In 2010 (to date), respondents have, on average, agreed or strongly agreed on quality on all items on the class evaluations Over a five year period, there has been a 20% increase in the number of community groups served, 40% increase in the number of activities scheduled, and 17% increase in the number of participants In 2009-2010, 207 students used the Kuder system, up from 102 in 2008-2009 See Table 2R2c for Career Center statistics Table 2R2a: Estimated Attendance at Cultural Events, 2007-2008 to 2009-2010 2007 – 2008 2008 – 2009 2009 – 2010 Type of Event Fall Spring Fall Spring Fall Spring Art Exhibits 1,100 1,318 1,900 800 850 1,050 Creative Writing 40 50 50 165 105 Foundation Events 75 500 688 433 Music 4,014 2,788 3,950 2,610 4,035 3,955 Student Workshops 32 245 85 Theatre and Dance 1,807 804 2,100 575 1,128 350 Total 7,068 5,205 8,450 4,723 6,263 5,893 Source: Arts and Humanities Division Category Two: Accomplishing Other Distinctive Objectives Page 37 Laramie County Community College November 2010 Table 2R2b: Total Enrollment in WFD Offerings 2006-07 Type of Offering Credit Workforce Development Courses Noncredit Workforce Development Courses Industry-specific Customized Training Workforce Development Courses Offered in Partnership with External Agencies 2007-08 2008-09 467 1,700 1,077 761 2,472 1,459 1,189 4,118 2,520 1,705 1,706 2,052 Note: Offerings may be counted in more than one category Source: Table 2R2c: Career Center Statistics1 Student Contacts Major/Career Research Resumes Employment Career Counseling/Coaching General Questions Total Contacts 1 yr % 2 yr % Change Change 2007-08 2008-09 2009-10 239 144 116 84 25 608 117 75 111 14 65 382 350 87 285 50 150 922 199.1% 16.0% 156.8% 257.1% 130.8% 141.4% 46.4% -39.6% 145.7% -40.5% 500.0% 51.6% 276 204 354 296 395 268 11.6% -9.5% 43.1% 31.4% 600-800 171 300-400 76 500+ 58 Student Employment Total Applications Total Hires Career Fair Participation2 Attendees Employers 1 During the calendar year 2009, the Career Center underwent several changes, including changes in location and personnel, which adversely impacted usage. 2 No Career Fairs were held in calendar year 2009. Source: Career Center Annual Report, August 2010 Area Table 2R1-2R2.2: Objective 2 – Promote Lifelong Learning Strategic Plan Goal Number 2R1: Measures 2R2: Performance Results PK-20 Programs 2.7 Participation in programs See Table 2R2d Career Pathway Development 2.7 Athletics Program 1.6 Career Pathway Development Templates Students served in the Hub@LCCC (Career Pathway Exploration and Coaching) GPAs of student athletes compared to the general LCCC student body GPA Life Enrichment 2.3 In 2010, approximately 80 new Career Pathway templates were completely developed From May 15 – July 30, 2010, approximately 200 clients were served in the Hub Average GPA of 2009-2010 student athletes was 2.91; for the general student body, the average GPA was 2.89. See Table 2R2e for trend data See Table 2R2f Number and type of offerings Participation Category Two: Accomplishing Other Distinctive Objectives Page 38 Laramie County Community College November 2010 Table 2R1-2R2.2: Objective 2 – Promote Lifelong Learning Strategic Plan Goal Number 2R1: Measures 2R2: Performance Results Area ESL (noncredit) ABE/GED/ASE 2.7 Foundation Support 2.2 Child Development Center 2.4 Hours of service Enrollment Hours attended Completion of level Number of donors Dollars raised Employee giving percentages Dollars distributed Number receiving funds Nutrition block grant outcomes Number of children served See Tables 2R2g and 2R2h. In the last five years, the foundation has had a(n): 194% increase in donors 67% increase in dollars 94% increase in employee giving Due to administrative shifts and accreditation efforts, trend data are not available Table 2R2d: Participation in PK-20 Programs 2007-2008 2008-2009 2009-2010 Concurrent/Dual Enrollment 1,113 1,184 1,197 Partnership Diploma Program 45 49 52 GEAR UP Summer Programs1 SOAR – High School Summer Academy 171 196 136 Junior High School Summer Leadership Academy 45 39 23 1 GEAR UP has experienced changes in personnel and funding which may have contributed to the declining participation in summer programs. Source: High School Programs Records Basketball Men’s Soccer Rodeo Women’s Soccer Volleyball Equine Show All Athletes LCCC FA 2.29 2.55 2.60 2.38 2.81 3.11 2.65 N/A Table 2R2e: Average GPA of Athletes 2007-2008 2008-2009 SP Ann. FA SP Ann. 2.20 2.24 2.48 2.20 2.36 2.47 2.51 2.75 3.00 2.88 2.85 2.71 2.82 2.83 2.82 2.75 2.56 2.57 2.62 2.60 2.24 2.52 3.05 2.79 2.92 3.18 3.18 3.26 2.87 3.08 2.68 2.67 2.85 2.75 2.80 2.55 N/A 2.72 2.59 2.54 FA 2.91 2.87 2.92 2.76 3.13 3.03 2.93 2.68 2009-2010 SP 2.52 3.07 3.01 3.05 3.11 3.39 3.04 N/A Ann. 2.70 2.95 2.98 2.89 3.12 3.17 2.98 2.91 Source: LCCC Athletics Department Category Two: Accomplishing Other Distinctive Objectives Page 39 Laramie County Community College November 2010 Table 2R2f: Total Enrollment in Life Enrichment Classes Course Category 2004-2005 2005-2006 2006-2007 2007-2008 Arts, Crafts and Hobbies Camps Children's Art and Activities Computer Conferences and Workshops Dance Dog Training Driver Training Eastern Laramie County Ed2Go (various online courses) Elder Hostel Health, Wellness and Safety Horsemanship Language Miscellaneous Personal Interest Personal Financial Information Summer Educational Experiences for Kids (SEEK) Swimming -- Adult Swimming -- Children Teacher Training Vendor Workshops (Frontier Days) Totals 248 212 22 81 277 66 226 172 155 72 285 151 120 136 84 312 115 55 56 90 118 236 12 149 167 43 202 78 47 82 25 295 99 94 123 70 136 181 56 69 37 14 107 55 15 94 253 74 83 256 129 121 76 66 113 238 70 23 143 90 440 562 558 614 921 473 48 584 81 40 598 65 522 54 129 501 54 47 54 40 67 67 2,857 3,058 3,200 3,018 3,330 74 216 99 111 75 2008-2009 370 154 102 164 165 140 Source: Colleague Records Program Year 2006-2007 2007-2008 2008-2009 2009-2010 Table 2R2g: Students Served by ACES Number of students Hours Open Hours Open per Week per Year All NRS 51 38 38 38 2,100 1,585 1,675 1,540 945 982 1,112 501 477 580 Not available Not available Source: Adult Career and Education System (ACES) Annual Report, 2009-2010 Level ABE Beginning Literacy ABE Beginning Education ABE Intermediate Low ABE Intermediate High ASE Low ASE High ESL Beginning Literacy ESL Low Beginning ESL High Beginning ESL Intermediate Low Student Contact Hours All NRS 20,513 26,833 35,010 18,143 24,332 28,889 Not available Not available Table 2R2h: 2008 - 2009 ABE/GED/ESOL Program Data LCCC Wyoming Hours Completed Hours Completed Enrolled Attended Level Enrolled Attended Level 17 82 116 197 81 91 49 12 8 17 611.86 4,729.39 5,402.33 10,980.66 2,091.45 3,141.91 2,721.56 866.39 375.79 1,255.02 Category Two: Accomplishing Other Distinctive Objectives 6 34 54 102 40 59 12 5 3 13 37 234 440 746 375 422 297 58 73 68 1,228.03 11,173.67 19,877.01 30,018.35 8,823.48 9,437.46 12,776.43 2,877.16 3,967.88 3,907.79 19 102 236 424 229 317 100 31 35 40 Page 40 Laramie County Community College November 2010 Table 2R2h: 2008 - 2009 ABE/GED/ESOL Program Data LCCC Wyoming Hours Completed Hours Completed Enrolled Attended Level Enrolled Attended Level Level ESL Intermediate High ESL Advanced TOTAL 24 7 701 1,891.22 1,018.78 35,086.36 7 4 339 91 36 2,877 5,086.66 1,959.53 111,133.45 33 13 1,579 Source: Adult Career and Education System (ACES) Annual Report, 2009-2010 Table 2R1-2R2.3: Objective 3 – Civic Engagement Strategic Plan 2R2: Performance Goal Number 2R1: Measures Results Area Service Learning 1.6 2.4 Number of service hours Number of student, programs, faculty Number of partners Athletic Teams 1.6 Number of home events The program has grown in the last three years to include: athletics program scholarship programs over a third of faculty members (38 in 20092010) See Table 2R2i for trend data See Table 2R2j Table 2R2i: Growth of Service Learning Program Academic Year 2006-2007 2007-2008 2008-2009 Number of Students Participating 54 350 658 Number of Service Hours 936 2196 13,136 Number of Faculty Integrating Service Learning 3 15 29 Number of Organizations Receiving Service 14 46 51 Source: Service Learning Program Coordinator Table 2R2j: Number of Home Games Events1 2008-2009 2009-2010 Basketball Volleyball Women’s Soccer Men’s Soccer Horse Shows Rodeos Total 12 9 9 6 2 1 39 13 9 6 5 1 1 35 1 Includes single games, multiple game events like volleyball tournaments, and multi-day events. Source: LCCC Athletics Department Category Two: Accomplishing Other Distinctive Objectives Page 41 Laramie County Community College November 2010 2R3 Currently, benchmarks have not been developed for the measures listed above. Based on Strategic Goals 3.1, “Create and implement both institutional and department assessment/effectiveness plans” and 3.3, “Foster cultural change to adopt continuous improvement principles college-wide”, the development of comparative benchmarks is in progress. 2R4 These results help the College achieve Strategic Direction 2, “Engage the community through collaborations that are mutually beneficial.” All the services and activities provided for community members and professional organizations strengthen relationships and provide mutually beneficial partnerships and community service. This is evidenced by the steady increase in the number of community partnerships, community member participants, service hours, utilization of facilities, and attendance of activities (see tables above). As an example, enrollments in workforce training programs are often statewide due to partnerships between LCCC, state agencies and the other six Wyoming community colleges. When workforce training was first offered in the 2002-2003 academic year, there were approximately 200 enrollments (duplicated) in two key training initiatives. In 2009-2010, there were approximately 3,000 enrollments (duplicated) in over 300 training initiatives. Improvements 2I1, 2I2 While the College collects a variety of quantitative data, to date, there has been limited use of setting targets or benchmarks to improve performance. The adoption of the new strategic and operational plans is serving to increase the systematic use of performance results for improvement. The Foundation, Service Learning coordinator, the Library, Athletics, Conferences and Events, Career Center, Children’s Discovery Center, and Workforce and Community Development have established some formal mechanisms to track the success of their programs. Some measurements are reported and analyzed systematically at the institutional level. Four areas annually report to the Board of Trustees, the Foundation, and/or college administration and other outside governing agencies. In addition, some of the areas have received grant funding which requires annual reporting. The Children’s Discovery Center reports outcomes to the NAYEC for accreditation and licensing authorities. LCCC recognizes an opportunity for improvement in this area and has initiated an action project to identify and develop institutional benchmarks as a first step. Category Two: Accomplishing Other Distinctive Objectives Page 42

