as a PDF - University of California, Irvine
advertisement
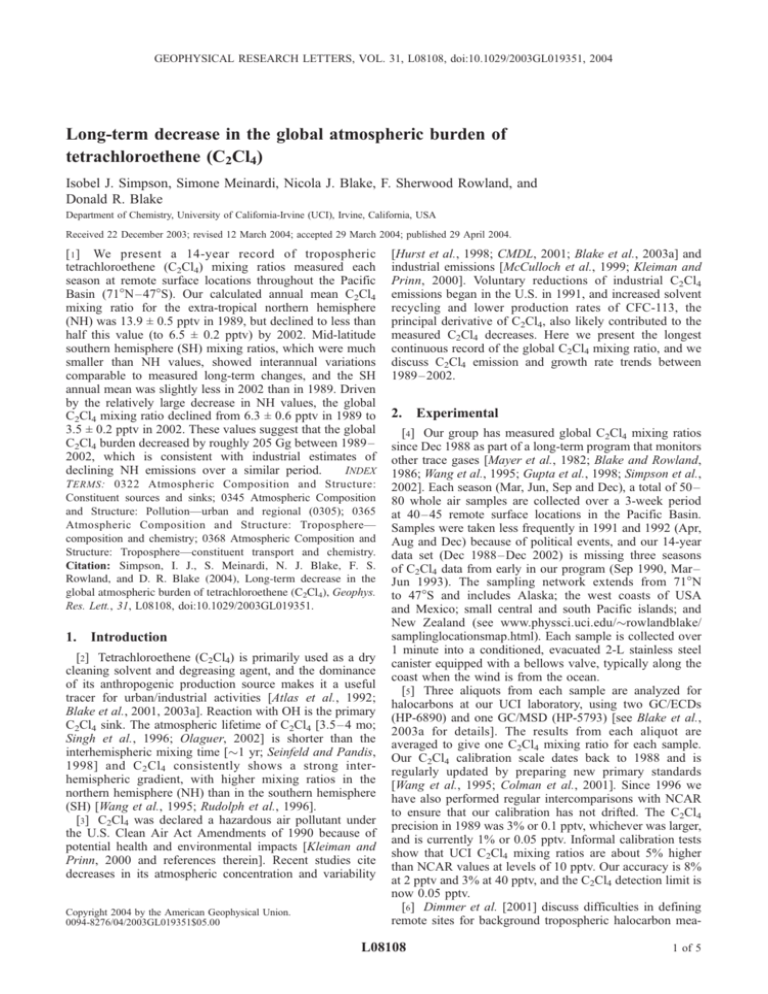
GEOPHYSICAL RESEARCH LETTERS, VOL. 31, L08108, doi:10.1029/2003GL019351, 2004 Long-term decrease in the global atmospheric burden of tetrachloroethene (C2Cl4) Isobel J. Simpson, Simone Meinardi, Nicola J. Blake, F. Sherwood Rowland, and Donald R. Blake Department of Chemistry, University of California-Irvine (UCI), Irvine, California, USA Received 22 December 2003; revised 12 March 2004; accepted 29 March 2004; published 29 April 2004. [ 1 ] We present a 14-year record of tropospheric tetrachloroethene (C2Cl4) mixing ratios measured each season at remote surface locations throughout the Pacific Basin (71°N – 47°S). Our calculated annual mean C2Cl4 mixing ratio for the extra-tropical northern hemisphere (NH) was 13.9 ± 0.5 pptv in 1989, but declined to less than half this value (to 6.5 ± 0.2 pptv) by 2002. Mid-latitude southern hemisphere (SH) mixing ratios, which were much smaller than NH values, showed interannual variations comparable to measured long-term changes, and the SH annual mean was slightly less in 2002 than in 1989. Driven by the relatively large decrease in NH values, the global C2Cl4 mixing ratio declined from 6.3 ± 0.6 pptv in 1989 to 3.5 ± 0.2 pptv in 2002. These values suggest that the global C2Cl4 burden decreased by roughly 205 Gg between 1989 – 2002, which is consistent with industrial estimates of INDEX declining NH emissions over a similar period. T ERMS : 0322 Atmospheric Composition and Structure: Constituent sources and sinks; 0345 Atmospheric Composition and Structure: Pollution—urban and regional (0305); 0365 Atmospheric Composition and Structure: Troposphere— composition and chemistry; 0368 Atmospheric Composition and Structure: Troposphere—constituent transport and chemistry. Citation: Simpson, I. J., S. Meinardi, N. J. Blake, F. S. Rowland, and D. R. Blake (2004), Long-term decrease in the global atmospheric burden of tetrachloroethene (C2Cl4), Geophys. Res. Lett., 31, L08108, doi:10.1029/2003GL019351. 1. Introduction [2] Tetrachloroethene (C2Cl4) is primarily used as a dry cleaning solvent and degreasing agent, and the dominance of its anthropogenic production source makes it a useful tracer for urban/industrial activities [Atlas et al., 1992; Blake et al., 2001, 2003a]. Reaction with OH is the primary C2Cl4 sink. The atmospheric lifetime of C2Cl4 [3.5 –4 mo; Singh et al., 1996; Olaguer, 2002] is shorter than the interhemispheric mixing time [1 yr; Seinfeld and Pandis, 1998] and C 2 Cl 4 consistently shows a strong interhemispheric gradient, with higher mixing ratios in the northern hemisphere (NH) than in the southern hemisphere (SH) [Wang et al., 1995; Rudolph et al., 1996]. [3] C2Cl4 was declared a hazardous air pollutant under the U.S. Clean Air Act Amendments of 1990 because of potential health and environmental impacts [Kleiman and Prinn, 2000 and references therein]. Recent studies cite decreases in its atmospheric concentration and variability Copyright 2004 by the American Geophysical Union. 0094-8276/04/2003GL019351$05.00 [Hurst et al., 1998; CMDL, 2001; Blake et al., 2003a] and industrial emissions [McCulloch et al., 1999; Kleiman and Prinn, 2000]. Voluntary reductions of industrial C2Cl4 emissions began in the U.S. in 1991, and increased solvent recycling and lower production rates of CFC-113, the principal derivative of C2Cl4, also likely contributed to the measured C2Cl4 decreases. Here we present the longest continuous record of the global C2Cl4 mixing ratio, and we discuss C2Cl4 emission and growth rate trends between 1989– 2002. 2. Experimental [4] Our group has measured global C2Cl4 mixing ratios since Dec 1988 as part of a long-term program that monitors other trace gases [Mayer et al., 1982; Blake and Rowland, 1986; Wang et al., 1995; Gupta et al., 1998; Simpson et al., 2002]. Each season (Mar, Jun, Sep and Dec), a total of 50– 80 whole air samples are collected over a 3-week period at 40– 45 remote surface locations in the Pacific Basin. Samples were taken less frequently in 1991 and 1992 (Apr, Aug and Dec) because of political events, and our 14-year data set (Dec 1988 – Dec 2002) is missing three seasons of C2Cl4 data from early in our program (Sep 1990, Mar – Jun 1993). The sampling network extends from 71°N to 47°S and includes Alaska; the west coasts of USA and Mexico; small central and south Pacific islands; and New Zealand (see www.physsci.uci.edu/rowlandblake/ samplinglocationsmap.html). Each sample is collected over 1 minute into a conditioned, evacuated 2-L stainless steel canister equipped with a bellows valve, typically along the coast when the wind is from the ocean. [5] Three aliquots from each sample are analyzed for halocarbons at our UCI laboratory, using two GC/ECDs (HP-6890) and one GC/MSD (HP-5793) [see Blake et al., 2003a for details]. The results from each aliquot are averaged to give one C2Cl4 mixing ratio for each sample. Our C2Cl4 calibration scale dates back to 1988 and is regularly updated by preparing new primary standards [Wang et al., 1995; Colman et al., 2001]. Since 1996 we have also performed regular intercomparisons with NCAR to ensure that our calibration has not drifted. The C2Cl4 precision in 1989 was 3% or 0.1 pptv, whichever was larger, and is currently 1% or 0.05 pptv. Informal calibration tests show that UCI C2Cl4 mixing ratios are about 5% higher than NCAR values at levels of 10 pptv. Our accuracy is 8% at 2 pptv and 3% at 40 pptv, and the C2Cl4 detection limit is now 0.05 pptv. [6] Dimmer et al. [2001] discuss difficulties in defining remote sites for background tropospheric halocarbon mea- L08108 1 of 5 L08108 SIMPSON ET AL.: LONG-TERM DECREASE IN ATMOSPHERIC C2Cl4 L08108 in the NH, with much lower usage and emission in the SH [McCulloch et al., 1999]. High-latitude NH C2Cl4 mixing ratios were 20– 25 pptv in Mar 1990 compared to 5 – 10 pptv in Mar 2002 (Figure 1a), clearly illustrating that NH C2Cl4 levels have decreased significantly over the past decade or so. [9] The overall low C2Cl4 mixing ratios in the SH and lack of C2Cl4 ‘hot spots’ in the equatorial and south Pacific suggest that oceanic sources of C2Cl4 [Singh et al., 1996; Khalil et al., 1999] play a relatively minor role, if any, in the C2Cl4 budget. During airborne missions over the Pacific our group has consistently noted a lack of evidence for oceanic C2Cl4 emissions, even in areas where other oceanic species such as CHBr3, CH3I, DMS, and/or light alkyl nitrates are strongly elevated [e.g., Blake et al., 2003b]. Therefore we suggest that most SH C2Cl4 originates from industrial emissions, either directly into the SH troposphere or transported from the NH. Figure 1. Latitudinal distribution of C2Cl4 at surface sites in the Pacific Basin (a) Mar 1990, 2002; (b) Sep 1989, 2001. surements because of local contamination. Here each C2Cl4 data point was inspected and those likely contaminated from local sources were removed (typically 1 – 5 samples per season). A second issue is the use of Pacific Basin measurements as a global surrogate. The concept of ‘background’ does not apply very well to C2Cl4 because it is short-lived relative to global mixing times and, unlike longer-lived compounds such as CH4, C2Cl4 mixing ratios decrease between ‘remote’ and ‘very remote’ sampling locations and show a fairly wide spread of atmospheric variability. Here we note that our sampling locations are remote but show more continental C2Cl4 influence than the CMDL network (Section 3.3). [7] For each season, global surface C2Cl4 mixing ratios were determined by separating the Earth into 16 latitudinal bands or ‘boxes’ containing roughly equal volumes of tropospheric air (the boundaries lie at the equator and 7.2, 14.5, 22.0, 30.0, 38.7, 48.6 and 61.0° in each hemisphere). Boxes where no data were collected (south of 48.6°S) were assigned extrapolated values and errors using data from neighbouring boxes (C2Cl4 is fairly well-mixed in the SH, Figures 1a and 1b; though see discussion in Section 3.3). Each global seasonal C2Cl4 mixing ratio is the mean of the 16 box averages. The uncertainty in each box average is the standard error, SE. The global seasonal mean uncertainty is the sum of SEs for each box, added in quadrature, divided by the number of boxes. The global annual mean uncertainty is the sum of SEs for each season added in quadrature. 3. Results and Discussion 3.1. Latitudinal Distribution [8] The measured C2Cl4 mixing ratios are higher in the NH than SH (Figure 1). Consistent with this, most industrial usage and therefore emission of C2Cl4 takes place 3.2. Seasonal Cycle [10] Seasonal C2Cl4 means were calculated in each hemisphere by averaging the four high-latitude NH boxes (30 – 90°N, chosen to avoid the steep transition from NH to SH mixing ratios at tropical NH latitudes) and the four most southerly boxes in which we sample (14.5 –48.6°S). C2Cl4 shows clear, anticorrelated seasonal signals in each hemisphere, with a much larger amplitude in the NH than SH (Figure 2). Maximum (minimum) C2Cl4 mixing ratios occur in late winter (summer) in each hemisphere, as verified in the SH using samples collected weekly at Norfolk Island (29°S) since 2001. Industrial C2Cl4 emissions likely are not seasonal [McCulloch and Midgley, 1996], and the summer C2Cl4 minimum is caused by the summer OH maximum in each hemisphere [Spivakovsky et al., 2000]. Though C2Cl4 reacts relatively quickly with chlorine radicals, Cl is not a significant C2Cl4 sink because average tropospheric Cl levels are typically low [Rudolph et al., 1996; Singh et al., 1996]. Further, the lifetime of C2Cl4 with marine boundary layer (MBL) Cl is much longer than the mixing time between the MBL and free troposphere [Wingenter et al., 1996]. Driven by the relatively high C2Cl4 levels in the Figure 2. Seasonal C2Cl4 mixing ratios in the high NH (30 – 90°N; circles) and mid-latitude SH (14 – 49°S; triangles). Curve fits are interpolated (pass through each point); gaps show missing seasons; error bars are described in the text. 2 of 5 L08108 SIMPSON ET AL.: LONG-TERM DECREASE IN ATMOSPHERIC C2Cl4 Figure 3. (a) Global seasonal C2Cl4 mixing ratios from Dec 1988 – Dec 2002; (b) Global annual C2Cl4 mixing ratios (UCI) and industrial emission estimates [McCulloch et al., 1999; A. McCulloch, personal communication, 2003]. In Figure 3b the two y-axes are aligned as described in Section 3.5. Curve fits are interpolated (seasonal and industrial data) and second-order polynomial (annual data); gaps show missing seasons; error bars are described in the text. NH and its strong seasonal cycle, the global C2Cl4 burden also peaks in late winter (Figure 3a). 3.3. Literature Comparison [11] For overlapping sampling periods (Sep 1989– Jun 1990), the global C2Cl4 mixing ratio from our network (7.3 pptv; Wang et al., 1995) agrees well with that of Rudolph et al. [1996] (8.4 pptv) to within the stated uncertainties. During an April – May 1998 cruise in the northeast Atlantic (20 – 63°N; 20°W), Dimmer et al. [2001] observed lower C2Cl4 mixing ratios for air masses originating over the open ocean (4.3 ± 0.8 pptv) than for those transported from northern Europe (9.7 ± 2.6 pptv). Our mean C2Cl4 mixing ratio at comparable latitudes during a similar time period (the average of Mar and Jun, 1998) was 9.0 ± 2.4 pptv. Calibration tests between the two laboratories show C2Cl4 agreement to within 10%, and the similarity of our results to their Europe-influenced (rather than open ocean) average suggests a comparable continental influence on our eastern Pacific samples. During airborne missions we have measured moderately elevated (by 2 – 4 pptv) C2Cl4 mixing ratios at low altitude over the eastern Pacific as a result of trans-Pacific Asian pollution [Blake et al., 2001, 2003a]. We suggest that Asian outflow has a low-level, pervasive influence on C2Cl4 mixing ratios over the eastern Pacific. By contrast, local contamination from North America likely causes the few C2Cl4 outliers observed in the NH during most of our sampling trips. [12] Annual global C2Cl4 mixing ratios from the NOAA/ CMDL network, which are available from 1995 – 2002 (CMDL-2003 scale), are lower than UCI estimates by 1.5– 2.7 pptv (factors of 1.7– 2.1) [CMDL, 2001; S. Montzka, personal communication, 2003]. This disparity lies outside the reported accuracy of each group and we believe it is L08108 primarily explained by sampling location differences. While the global mean from CMDL was calculated from a smaller number of very remote locations (Alert, Barrow, Niwot Ridge, Mauna Loa, Kumukahi, Samoa, Cape Grim, and South Pole), our measurements are likely more influenced by low-level continental emissions, as discussed above for the NH. In the SH this is consistent with our Dec 1995 New Zealand C2Cl4 data, which are 1 – 1.5 pptv higher than MBL aircraft data collected at the same time but south of New Zealand in a more remote region (to 60°S) [Blake et al., 1999]. [13] The actual amount of C2Cl4 in the atmosphere at any time includes mixing ratios in urban, rural, remote and very remote locations. Because much industriallyemitted C2Cl4 decays during transport to very remote locations, measurements made in such locations will underestimate instantaneous global C2Cl4 levels. We suggest that our measurements consistently represent ‘remote’ rather than ‘very remote’ mixing ratios. 3.4. Mixing Ratio Trends [14] The annual global C2Cl4 mixing ratio inferred from our measurements nearly halved during the measurement period, from 6.3 ± 0.6 pptv in 1989 to 3.5 ± 0.2 pptv in 2002 (Figure 3b). The C2Cl4 decline was not linear but increased from about 0.1 pptv yr 1 in 1990 to 0.4 pptv yr 1 in 2002. C2Cl4 mixing ratios in the high-latitude NH (30 – 90°N) decreased from 13.9 ± 0.5 pptv in 1989 to 6.6 ± 0.3 pptv in 2002, indicating that the global decrease was primarily driven by changes in the NH (Figure 2). The interhemispheric ratio of C2Cl4 (high-latitude NH values mid-latitude SH values) declined from 7.1 ± 0.6 in 1989 to 4.5 ± 0.3 in 2002. The peak-to-trough amplitude of the global C2Cl4 seasonal signal also decreased in the 1990s, from 4 –5 pptv in 1989 – 90 to 1.5– 2 pptv in 2001 – 02 (Figure 3a). Between 1995– 2002 the UCI data show a 30% decrease in annual global C2Cl4 mixing ratios (Figure 3b), and by comparison the data from CMDL show a 25% decrease over this same period [S. Montzka, personal communication, 2003]. [15] In the mid-latitude SH, the annual C2Cl4 mixing ratio was 2.1 ± 0.2 pptv in 1989; remained fairly constant between 1989– 95; notably increased in mid-1996; then declined by roughly a factor of two from 2.9 ± 0.2 pptv in 1997 to 1.5 ± 0.1 pptv in 2002. A C2Cl4 increase beginning in late-1996 is also evident in the NH (Figure 2). Interestingly, the C2Cl4 increase in both hemispheres occurred shortly after the Montreal Protocol ban on CFCs, which became effective in many countries on Jan 1, 1996. It is likely that some of the CFC solvent usage banned under the Protocol temporarily shifted to non-protocol solvents such as C2Cl4 in both hemispheres, shortly after the prohibition took effect. 3.5. Global Emissions [16] Using a single box model calculation, a global C2Cl4 lifetime of 4 months, and accounting for a mean, 10% decrease in C2Cl4 mixing ratios with height in the troposphere [see Wang et al., 1995], the global C2Cl4 mixing ratios in 1989, 2000 and 2002 correspond to annual emissions of 465 ± 45, 330 ± 20, and 260 ± 15 Gg yr 1, respectively (Figure 3b). Global industrial C2Cl4 emission 3 of 5 L08108 SIMPSON ET AL.: LONG-TERM DECREASE IN ATMOSPHERIC C2Cl4 estimates (based on audited sales data) are available until 2000 and were 423 ± 21 in 1989 and 268 ± 13 Gg yr 1 in 2000 [McCulloch et al., 1999; A. McCulloch, personal communication, 2003]. Though the 42 –62 Gg yr 1 offset between the UCI and McCulloch et al. estimates may be related to a combination of uncertainty and our network’s proximity to C2Cl4 source regions (Section 3.3), which requires a systematic offset of only 0.75 pptv to give an additional emission of 55 Gg yr 1, our emission calculation does not account for longitudinal spatial gradients in C2Cl4 or OH, and we cannot draw this conclusion with certainty. [17] Because we sample in the same narrow range of longitudes (per latitude band) each season, our measurements are suitable for year-to-year trend analysis. Our annual mixing ratios suggest a global C2 Cl 4 burden decrease of 135 Gg between 1989 – 2000 and 205 Gg between 1989– 2002. The former estimate is consistent with the 155 Gg global industrial emission decline for 1989 – 2000. However the pattern of this decrease differs between UCI and McCulloch et al. Whereas the UCI C2Cl4 burden decreases at an increasing rate, the industrial estimates sharply decrease between 1989 – 94 then stabilize between 1995 – 2000 (Figure 3b). The UCI measurements and McCulloch et al. estimates are each internally consistent, and the reason for this difference is unclear. It is unlikely that meteorology contributes to long-term trends in global growth rates [Warwick et al., 2002] or that variations in global OH levels caused the difference [Krol et al., 2003]. Together with A. McCulloch (University of Bristol) we investigated whether unreported/changing C2Cl4 production in the 1990s could have caused the discrepancy. Though we found there has been a major shift of C2Cl4 emissions from Japan to industrial regions of China (mostly in the northeast) in the past decade, their combined emissions have stayed fairly constant at around 45 Gg yr 1. Instead, global C2Cl4 emission reductions have been driven mainly by North America and Europe. It also appears unlikely that the global distribution of C2Cl4 emissions has shifted latitudinally so as to significantly affect C2Cl4 mixing ratio trends based on latitudinal gradients in OH. We speculate that the slower decline in observed C2Cl4 mixing ratios compared to industrial emission estimates is related to a slower than anticipated introduction of technology to reduce industrial C2Cl4 leakage/emissions. 4. Conclusions [18] The global C2Cl4 burden shows a long-term decrease over the 14-year period 1989 – 2002, declining more rapidly from 0.1 pptv yr 1 in 1990 to 0.4 pptv yr 1 in 2002. The global decline is driven by reduced industrial emissions primarily from North America and Europe. A small C2Cl4 increase in each hemisphere in 1996 likely resulted from increased C2Cl4 usage immediately following the first phase of the Montreal Protocol. Our measurements and industrial emission estimates suggest a total C2Cl4 burden decrease of 135 –155 Gg between 1989 – 2000. However the pattern of C2Cl4 decline differs between the two estimates, possibly related to a slow introduction of technology to reduce C2Cl4 release into the atmosphere. [19] Comparisons with other studies highlight the variability of C2Cl4 mixing ratios depending on proximity to L08108 local sources, and show the pervasive, low-level influence of Asian outflow on C2Cl4 values over the eastern Pacific. By contrast, our observations suggest that an oceanic source of C2Cl4, if present, is relatively minor. [20] Acknowledgments. We dedicate this work to Murray McEachern, whose outstanding logistical and interpersonal skills have been central to this project’s success. We thank our group members for sample collection and analysis, Archie McCulloch (Univ. of Bristol) and Stephen Montzka (NOAA/CMDL) for valuable discussions and for sharing unpublished data, and Oliver Wingenter for helpful discussions. The project is funded by NASA contract NAGW-452. References Atlas, E., et al. (1992), Alkyl nitrate and selected halocarbon measurements at Mauna Loa Observatory, Hawaii, J. Geophys. Res., 97(D10), 10,331 – 10,348. Blake, D. R., and F. S. Rowland (1986), Global atmospheric concentrations and source strengths of ethane, Nature, 321, 231 – 233. Blake, N. J., et al. (1999), Aircraft measurements of the latitudinal, vertical, and seasonal variations of NMHCs, methyl nitrate, methyl halides, and DMS during the First Aerosol Characterization Experiment (ACE 1), J. Geophys. Res., 104(D17), 21,803 – 21,817. Blake, N. J., et al. (2001), Large scale latitudinal and vertical distributions of NMHCs and selected halocarbons in the troposphere over the Pacific Ocean during the March – April 1999 Pacific Exploratory Expedition (PEM Tropics B), J. Geophys. Res., 106(D23), 32,627 – 32,644. Blake, N., et al. (2003a), NMHCs and halocarbons in Asian continental outflow during the Transport and Chemical Evolution over the Pacific (TRACE-P) Field Campaign: Comparison With PEM-West B, J. Geophys. Res., 108(D20), 8806, doi:10.1029/2002JD003367. Blake, N. J., et al. (2003b), Latitudinal, vertical, and seasonal variations of C1 – C4 alkyl nitrates in the troposphere over the Pacific Ocean during PEM-Tropics A and B: Oceanic and continental sources, J. Geophys. Res., 108(D2), 8242, doi:10.1029/2001JD001444. CMDL (Climate Monitoring and Diagnostics Laboratory) (2001), CMDL Summary Report #26 (2000 – 2001), U.S. Dept. of Commerce/NOAA/ ORL/CMDL, Boulder, CO. Colman, J. J., et al. (2001), Description of the analysis of a wide range of volatile organic compounds in whole air samples collected during PEM-Tropics A and B, Anal. Chem., 73, 3723 – 3731. Dimmer, C. H., et al. (2001), Tropospheric concentrations of the chlorinated solvents, tetrachloroethene and trichloroethene, measured in the remote northern hemisphere, Atmos. Environ., 35, 1171 – 1182. Gupta, M. L., et al. (1998), Global atmospheric distributions and source strengths of light hydrocarbons and tetrachloroethene, J. Geophys. Res., 103(D21), 28,219 – 28,235. Hurst, D. F., et al. (1998), Recent trends in the variability of halogenated trace gases over the United States, J. Geophys. Res., 103(D19), 25,299 – 25,306. Khalil, M. A. K., et al. (1999), Natural emissions of chlorine-containing gases: Reactive chlorine emissions inventory, J. Geophys. Res., 104(D7), 8333 – 8346. Kleiman, G., and R. G. Prinn (2000), Measurement and deduction of emissions of trichloroethene, tetrachloroethene, and trichloromethane (chloroform) in the northeastern United States and southeastern Canada, J. Geophys. Res., 105(D23), 28,875 – 28,984. Krol, M. C., et al. (2003), Continuing emissions of methyl chloroform from Europe, Nature, 421, 131 – 135. Mayer, E. W., et al. (1982), Methane: Interhemispheric concentration gradient and atmospheric residence time, Proc. Natl. Acad. Sci., 79, 1366 – 1370. McCulloch, A., and P. M. Midgley (1996), The production and global distribution of emissions of trichloroethene, tetrachloroethene, and dichloromethane over the period 1988 – 1992, Atmos. Environ., 30, 601 – 608. McCulloch, A., et al. (1999), Industrial emissions of trichloroethene, tetrachloroethene, and dichloromethane: Reactive chlorine emissions inventory, J. Geophys. Res., 104(D7), 8417 – 8428. Olaguer, E. P. (2002), The distribution of the chlorinated solvents dichloromethane, perchloroethylene, and trichloroethylene in the global atmosphere, Environ. Sci. Poll. Res., 9, 175 – 182. Rudolph, J., et al. (1996), The budgets of ethane and tetrachloroethene: Is there evidence for an impact of reactions with chlorine atoms in the troposphere?, Atmos. Environ., 33, 1887 – 1894. Seinfeld, J. H., and S. N. Pandis (1998), Atmospheric Chemistry and Physics, John Wiley & Sons, New York. 4 of 5 L08108 SIMPSON ET AL.: LONG-TERM DECREASE IN ATMOSPHERIC C2Cl4 Simpson, I. J., et al. (2002), Implications of the recent changes in the growth rate of tropospheric methane, Geophys. Res. Lett., 29(10), 1479, doi:10.1029/2001GL014521. Singh, H. B., et al. (1996), Tetrachloroethylene as an indicator of low Cl atom concentrations in the troposphere, Geophys. Res. Lett., 23(12), 1529 – 1532. Spivakovsky, C. M., et al. (2000), Three-dimensional climatological distribution of tropospheric OH: Update and evaluation, J. Geophys. Res., 105(D7), 8931 – 8980. Wang, C. J.-L., et al. (1995), Seasonal variations in the atmospheric distribution of a reactive chlorine compound, tetrachloroethene (CCl2 = CCl2), Geophys. Res. Lett., 22(9), 1097 – 1100. L08108 Warwick, N. J., et al. (2002), The impact of meteorology on the interannual growth rate of atmospheric methane, Geophys. Res. Lett., 29(20), 1947, doi:10.1029/2002GL015282. Wingenter, O. W., et al. (1996), Hydrocarbons and halocarbon measurements as photochemical and dynamical indicators of atmospheric hydroxyl, atomic chlorine, and vertical mixing obtained during Lagrangian flights, J. Geophys. Res., 101(D2), 4331 – 4340. D. R. Blake, N. J. Blake, S. Meinardi, F. S. Rowland, and I. J. Simpson, Department of Chemistry, University of California-Irvine (UCI), Irvine, CA, USA. (isimpson@uci.edu) 5 of 5
