How to Interpret a Water Analysis Report
advertisement
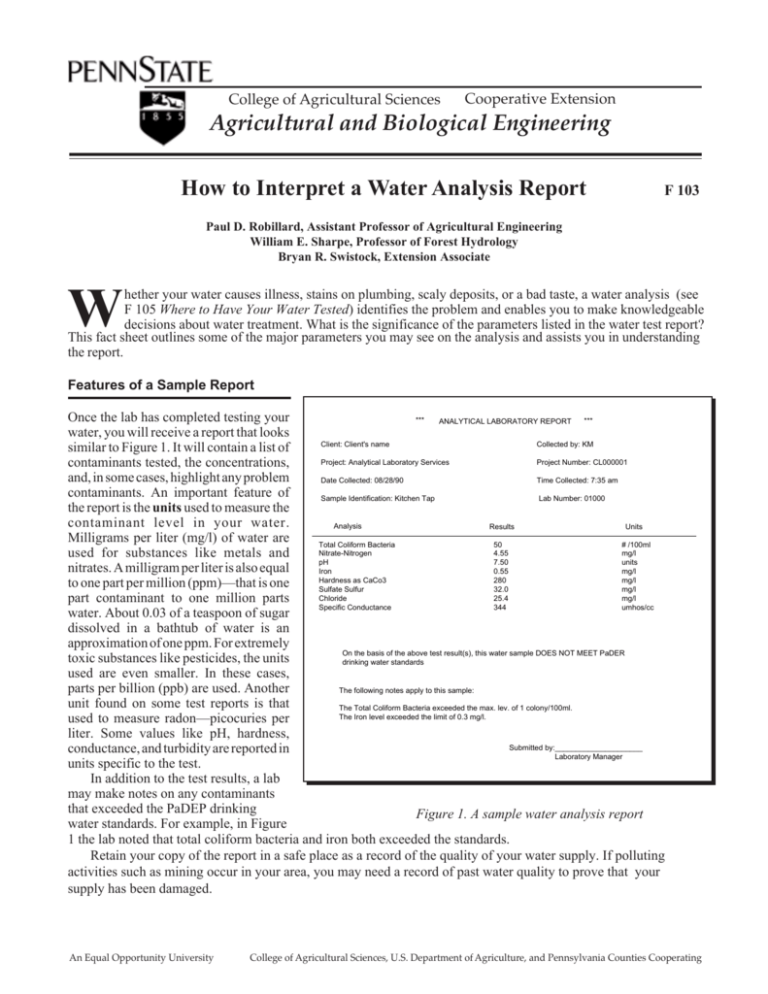
College of Agricultural Sciences Cooperative Extension Agricultural and Biological Engineering How to Interpret a Water Analysis Report F 103 Paul D. Robillard, Assistant Professor of Agricultural Engineering William E. Sharpe, Professor of Forest Hydrology Bryan R. Swistock, Extension Associate W hether your water causes illness, stains on plumbing, scaly deposits, or a bad taste, a water analysis (see F 105 Where to Have Your Water Tested) identifies the problem and enables you to make knowledgeable decisions about water treatment. What is the significance of the parameters listed in the water test report? This fact sheet outlines some of the major parameters you may see on the analysis and assists you in understanding the report. Features of a Sample Report Once the lab has completed testing your *** *** ANALYTICAL LABORATORY REPORT water, you will receive a report that looks Collected by: KM Client: Client's name similar to Figure 1. It will contain a list of Project Number: CL000001 Project: Analytical Laboratory Services contaminants tested, the concentrations, and, in some cases, highlight any problem Time Collected: 7:35 am Date Collected: 08/28/90 contaminants. An important feature of Lab Number: 01000 Sample Identification: Kitchen Tap the report is the units used to measure the contaminant level in your water. Analysis Results Units Milligrams per liter (mg/l) of water are # /100ml 50 Total Coliform Bacteria mg/l 4.55 Nitrate-Nitrogen used for substances like metals and units 7.50 pH nitrates. A milligram per liter is also equal mg/l 0.55 Iron mg/l 280 Hardness as CaCo3 to one part per million (ppm)—that is one mg/l 32.0 Sulfate Sulfur mg/l 25.4 Chloride part contaminant to one million parts umhos/cc 344 Specific Conductance water. About 0.03 of a teaspoon of sugar dissolved in a bathtub of water is an approximation of one ppm. For extremely On the basis of the above test result(s), this water sample DOES NOT MEET PaDER toxic substances like pesticides, the units drinking water standards used are even smaller. In these cases, parts per billion (ppb) are used. Another The following notes apply to this sample: unit found on some test reports is that The Total Coliform Bacteria exceeded the max. lev. of 1 colony/100ml. The Iron level exceeded the limit of 0.3 mg/l. used to measure radon—picocuries per liter. Some values like pH, hardness, Submitted by:_____________________ conductance, and turbidity are reported in Laboratory Manager units specific to the test. In addition to the test results, a lab may make notes on any contaminants that exceeded the PaDEP drinking Figure 1. A sample water analysis report water standards. For example, in Figure 1 the lab noted that total coliform bacteria and iron both exceeded the standards. Retain your copy of the report in a safe place as a record of the quality of your water supply. If polluting activities such as mining occur in your area, you may need a record of past water quality to prove that your supply has been damaged. An Equal Opportunity University College of Agricultural Sciences, U.S. Department of Agriculture, and Pennsylvania Counties Cooperating Water test parameters The following tables provide a general guideline to common water quality parameters that may appear on your water analysis report. The parameters are divided into three categories: health risk parameters, general indicators, and nuisance parameters. These guidelines are by no means exhaustive. However, they will provide you with acceptable limits and some information about symptoms, sources of the problem and effects. To find out more about how to treat the water or eliminate the contaminant at the source, see related publication F 103 How to Interpret a Water Analysis Report. See the end of this publication for information on how to obtain additional publications. Table 1 Health Risk Parameters. The parameters in Table 1 are some commons ones that have known health effects. The table lists acceptable limits, potential health effects, and possible uses and sources of the contaminant. Table 2 General Water Quality Indicators are parameters used to indicate the presence of harmful contaminants. Testing for indicators can eliminate costly tests for specific contaminants. Generally, if the indicator is present, the supply may contain the contaminant as well. For example, turbidity or the lack of clarity in a water sample usually indicates that bacteria may be present. The pH value is also considered a general water quality indicator. High or low pHs can indicate how corrosive water is. Corrosive water may further indicate that metals like lead or copper are being dissolved in the water as it passes through distribution pipes. Table 2 shows some of the common general indicators. Table 1: Standards, symptoms, and potential health effects of regulated contaminants. Contaminant Acceptable Limit Sources/Uses Potential Health Effects at High Concentrations 3ppb or .003 ppm used as a herbicide; surface or groundwater contamination from heart and liver damage agricultural runoff or leaching 5ppb or .005 ppm gasoline additive; usually from accidental oil spills, industrial uses, or landfills blood disorders like aplasticaremia; immune system depression; acute exposure affects central nervous system causing dizziness, headaches; long term exposure increases cancer risks Lead at tap 0.01 mg/l used in batteries; lead gasolines and pipe solder; may be leached from brass faucets, lead caulking, lead pipes, and lead soldered joints nervous disorders and mental impairment, especially in fetuses and infants; kidney damage; blood disorders and hypertension; low birth weights Nitrates (NO3) 10 mg/l (nitrate-N) 45 mg/l (nitrate) soil by-product of agricultural fertilization; human and animal waste leaching to groundwater methemoglobinemia (blue baby disease) in infants (birth-6 months); low health threat to children and adults Total Coliform <1 coliform/100 ml possible bacterial or viral contamination from human sewage or animal manure diarrheal diseases, constant high level exposure can lead to cholera and hepatitis 300 pCi/l* naturally occurring gas formed from uranium decay; can seep breathing gas increases chances of lung into well water from surrounding cancer; may increase risk of stomach, rocks and be released in the air colon and bladder cancers as it leaves the faucet Atrazine Benzene Radon * Recommended level in water at which remedial action should be taken. No mandatory standards have been set. Table 2. General water quality indicators. Indicator Acceptable Limit Indication pH value 6.5 to 8.5 An important overall measure of water quality, pH can alter corrosivity and solubility of contaminants. Low pH will cause pitting of pipes and fixtures or a metallic taste. This may indicate that metals are being dissolved. At high pH, the water will have a slippery feel or a soda taste. Turbidity <5 TU Total Dissolved Solids (TDS) 500 mg/l Nuisance contaminants are a third category of contaminants. While these have no adverse health effects, they may make water unpallatable or reduce the effectiveness of soaps and detergents. Some nuisance contaminants also cause staining. Nuisance contaminants may include iron bacteria, hydrogen sulfide, and hardness. Table 3 shows some typical nuisance contaminants you may see on your water analysis report. Hardness is one contaminant you will also commonly see on the report. Hard water is a purely aesthetic problem that causes soap and scaly deposits in plumbing and decreased cleaning action of soaps and detergents. Hard water can also cause scale buildup in hot water heaters and reduce their effective lifetime. Table 4 will help you interpret the hardness parameters cited on your analysis. Note that the units used in this table differ from those indicated in Figure 1. Hardness can be expressed by either mg/l or a grains per gallon (gpg). A gpg is used exclusively as a hardness unit and equals approximately 17 mg/l or ppm. Most people object to water falling in the "hard" or "very hard" categories in Table 4. However, as with all water treatment, you should carefully consider the advantages and disadvantages to softening before making a purchasing a water softener. Clarity of sample can indicate contamination. Dissolved minerals like iron or manganese. High TDS also can indicate hardness (scaly deposits) or cause staining, or a salty, bitter taste. Additional Resources For more detailed information about water testing ask for publication Water Tests: What Do the Numbers Mean? at your local extension office or from the following sources. Please access: Website: http://wqext.psu.edu Email: mxh16@psu.edu Fax: (814) 863-1031 Phone: (814) 865-7685 For more information about other Outreach Publications and Resources from the Department of Agricultural and Biological Engineering: Website: http://www.age.psu.edu Email: aqm5@psu.edu Address: Penn State 246 Agricultural Engineering Bldg. University Park, PA 16802 Phone: (814) 865-7685 Fax: (814) 863-1031 PSU rev. 8/01 Table 3. Common nuisance contaminants and their effects. Contaminant Acceptable Limit Effects Chlorides 250 mg/l salty or brackish taste; corrosive; blackens and pits stainless steel Copper (Cu) 1.3 mg/l blue-green stains on plumbing fixtures; bitter metalic taste Iron (Fe) 0.3 mg/l metallic taste; discolored beerages; yellowish stains, stains laundry Manganese (Mn) 0.05 mg/l or 5 ppb Sulfates (SO4) Iron Bacteria 250 mg/l black stains on fixtures and laundry; bitter taste greasy feel, laxative effect present orangeish to brownish slime in water Table 4. Hardness classifications. Concentration of hardness minerals in grains per gallon (GPG) Hardness Level below 1.0 soft 1.0 to 3.5 slightly hard 3.5 to 7.5 moderately hard 7.5 to 10.5* hard 10.5 and above very hard * level at which most people find hardness objectionable The Pennsylvania State University is committed to the policy that all persons shall have equal access to programs, facilities, admission, and employment without regard to personal characteristics not related to ability, performance, or qualifications as determined by University policy or by state or federal authorities. It is the policy of the University to maintain an academic and work environment free of discrimination, including harassment. The Pennsylvania State University prohibits discrimination and harassment against any person because of age, ancestry color, disability or handicap, national origin, race, religious creed, sex, sexual orientation, or veteran status. Discrimination or harassment against faculty, staff, or students will not be tolerated at The Pennsylvania State University. Direct all inquiries regarding the nondiscrimination policy to the Affirmative Action Director, The Pennsylvania State University, 201 Willard Building, University Park, PA 16802-2801, Tel 814-865-4700/V, 814863-1150/TTY.
